What you’ll learn #
Backend teams use durable execution engines like Temporal for multi-step workflows: payments, order fulfilment, LLM agent loops, scheduled jobs. “Run this 4-step thing, retry on failure, wait for a webhook on step 3” becomes a few lines of code.
Those few lines have a cost in the database. This post measures it. By the end you’ll know:
- What Temporal does in Postgres: every table it creates, every SQL statement per workflow, and why each one exists
- What durability costs: in queries, in storage, and in throughput
- What a simpler alternative looks like: I benchmark Absurd1, a single-SQL-file durable-execution engine by Armin Ronacher, against Temporal on the same workload
- When Temporal’s complexity is worth its cost, with cost models you can apply to your own workload
The main results:
A Temporal install on Postgres creates 37 tables. A 3-activity workflow executes ~145 SQL statements against 16 of them. Absurd does the same 3-step job with ~32 SQL statements against 3 tables, at ~20× the throughput on the same hardware.
The rest of the post explains what the extra ~113 statements do.
This post measures what each Temporal feature costs. It does not conclude that Temporal is overkill, because the two systems solve different versions of the same problem.
Two writes and a crash #
A service that writes to its database and calls another service is already a distributed system:
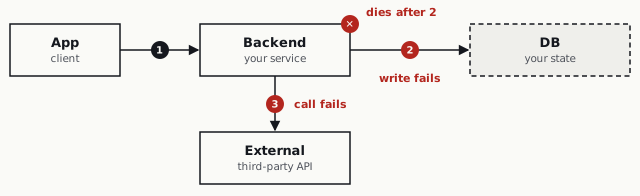
Step 2 (DB write) and step 3 (external call) can each fail: a bug, a network error, a third-party outage, a database failover, a lost instance. A failure at step 2 is often worse, because the database is where you would record that step 3 needs a retry. The worst case is a crash between them. The database says the order exists, and nothing records that step 3 still needs to run. You need both calls to happen at least once, and the system to converge.
Common approaches:
- Saga
- CQRS — Command Query Responsibility Segregation
- Event sourcing
- Outbox Pattern must read
- Durable Functions / Workflow Engine
This post is about the last one, and what it costs to run.
Durable execution systems #
A durable execution system records the state of each workflow as it runs. When a host or the code fails, another machine continues the execution from the point where it stopped, so step 3 still runs. Temporal is the best-known open-source one. Others:
| System | Runtime | Storage | License | Notes |
|---|---|---|---|---|
| Temporal | Go server | Pluggable (Postgres, MySQL, Cassandra) | MIT | Fork of Cadence |
| Cadence | Go server | same | MIT | The original, by Uber |
| Conductor | Java server | Cassandra / MySQL / Postgres / Redis | Apache-2.0 | By Netflix, now OSS fork |
| Restate | Rust server | own storage | BSL | Single binary |
| DBOS | Python/TS SDK | Postgres | MIT | SDK-heavy, ~22k LOC Python |
| Inngest | Go server | Postgres + Redis | SSPL | Event-driven, HTTP-based |
| Absurd | none (SDK only) | Postgres | Apache-2.0 | One SQL file, pull-based |
| CloudFlare Workflows | Workers runtime | Cloudflare | proprietary | Managed only |
| AWS Step Functions | AWS | AWS | proprietary | Managed only |
| Azure Durable Functions | Azure | Azure Storage | proprietary | Managed only |
This post measures two of them: Temporal, and Absurd, which fits in one SQL file.
Vocabulary #
Both systems use the same ideas under slightly different names.
| Temporal | Absurd | What it is |
|---|---|---|
| Workflow | Task | The top-level durable function |
| Activity | Step | A checkpointed unit of work inside a workflow |
| Worker | Worker | A process that pulls work and runs user code |
| Task Queue | Queue | A named queue that workers poll for tasks |
| Workflow run | Run | One execution attempt of a task |
| Event History | Checkpoints | The replay state |
| Signal | Event | An external message that wakes a workflow |
The activity/step is the unit of checkpointing. When it completes, its result is persisted, and a re-run of the workflow skips it. That is what makes the workflow durable.
How Temporal runs #
Your worker is stateless and talks to the Temporal server over gRPC. The server is four internal services that share one database (Postgres, MySQL, or Cassandra). They can run as separate processes or together in one.
Frontend terminates gRPC, authenticates, and routes requests to one of the three back-end services. History manages workflow state machines (executions, event history, scheduled tasks). Matching runs the task queues that activities and workflow tasks are dispatched through. Worker runs Temporal’s own internal maintenance workflows. It is not related to your worker processes.
The services keep no state of their own; Postgres holds all of it. To scale Temporal, you add service replicas. The database does not scale that way.
What Temporal writes to Postgres #
I use Postgres because it is the easiest backend to inspect. Most production Temporal clusters end up database-bound, so I measure the database.
The schema #
A fresh Temporal 1.28 auto-setup installs 37 tables. The main ones:
shards                   ─ one row per range of workflows (the unit of sharding)
executions               ─ current workflow state (blob, protobuf-encoded)
current_executions       ─ "which run_id is current for this workflow_id"
history_node             ─ event history (append-only, replayed on load)
history_tree             ─ branch metadata for history_node
tasks                    ─ matching service queues (dispatches activities)
task_queues              ─ matching service queue metadata
transfer_tasks           ─ "schedule an activity" intents
timer_tasks              ─ "wake me up at time T" intents
visibility_tasks         ─ "update the search index" intents
replication_tasks        ─ cross-cluster replication queue
activity_info_maps       ─ in-flight activity metadata per workflow
timer_info_maps          ─ user timers per workflow
buffered_events          ─ events waiting to be written to history
cluster_membership       ─ which server nodes are alive
namespaces               ─ tenant isolation
The other 21 tables cover request cancellations, signals, child workflows, chasm nodes, namespace metadata, nexus endpoints, the replication DLQ, and schema versioning2. Each table supports a specific distributed-systems guarantee.
Sharding: workflows → shards #
When a workflow is created, Temporal computes which shard it belongs to3:
// common/util.go — upstream Temporal source
func WorkflowIDToHistoryShard(
    namespaceID string,
    workflowID string,
    numberOfShards int32,
) int32 {
    idBytes := []byte(namespaceID + "_" + workflowID)
    hash := farm.Fingerprint32(idBytes)
    return int32(hash%uint32(numberOfShards)) + 1
}
A (namespace_id, workflow_id) pair hashes to a shard_id. One History
instance at a time handles that shard. Every write for that workflow (executions, history
events, scheduled tasks) goes to that shard.
The default numHistoryShards in dev is 4. A production cluster uses 512 or
2048. You cannot change this number without re-sharding your database, so
teams over-provision it up front.
The shard table:
CREATE TABLE shards (
    shard_id integer NOT NULL,
    range_id bigint  NOT NULL,   -- monotonic fencing token
    data        bytea   NOT NULL,
    data_encoding varchar(16) NOT NULL,
    CONSTRAINT shards_pkey PRIMARY KEY (shard_id)
);
range_id is a fencing token. When a history host acquires a shard,
it increments range_id with an UPDATE shards. Every later write from that
host checks range_id in the same transaction, so a host that lost the shard
gets rejected.
This is how Temporal ensures that only one host mutates a workflow’s state
at a time. You will see SELECT range_id FROM shards WHERE shard_id = $1 FOR SHARE
on every workflow mutation.
The executions table: current state #
The executions table stores a workflow’s current state:
CREATE TABLE executions (
    shard_id             integer NOT NULL,
    namespace_id         bytea   NOT NULL,
    workflow_id          varchar(255) NOT NULL,
    run_id               bytea   NOT NULL,
    next_event_id        bigint  NOT NULL,
    last_write_version   bigint  NOT NULL,
    data                 bytea   NOT NULL,   -- protobuf-encoded WorkflowMutableState
    data_encoding        varchar(16) NOT NULL,
    state                bytea   NOT NULL,
    state_encoding       varchar(16) NOT NULL,
    db_record_version    bigint  NOT NULL DEFAULT 0,
    PRIMARY KEY (shard_id, namespace_id, workflow_id, run_id)
);
The data column holds a protobuf-serialised WorkflowMutableState: the
full current state, including pending activities, timers, and child
workflows. Temporal reads the blob, changes it in memory, and writes it back.
db_record_version is a second fencing token, for optimistic-concurrency
writes on one workflow. With range_id, Temporal has a single writer at two
levels: shard and workflow.
history_node: the event log #
Temporal is event-sourced. The authoritative state of a workflow is the
sequence of events it emitted. The executions blob is a cache.
CREATE TABLE history_node (
    shard_id      integer NOT NULL,
    tree_id       bytea   NOT NULL,
    branch_id     bytea   NOT NULL,
    node_id       bigint  NOT NULL,
    prev_txn_id   bigint  NOT NULL,
    txn_id        bigint  NOT NULL,
    data          bytea   NOT NULL,       -- batch of protobuf events
    data_encoding varchar(16) NOT NULL,
    PRIMARY KEY (shard_id, tree_id, branch_id, node_id, txn_id)
);
One row (“node”) holds a batch of events. This is the full history of one
OrderFulfillmentWorkflow run from my benchmark. It calls three activities
in sequence:
 1  WorkflowExecutionStarted   {WorkflowType:OrderFulfillmentWorkflow, Input:...}
 2  WorkflowTaskScheduled      {TaskQueue:order-fulfillment-q, Attempt:1}
 3  WorkflowTaskStarted        {ScheduledEventId:2, Identity:36960@host}
 4  WorkflowTaskCompleted      {ScheduledEventId:2, StartedEventId:3}
 5  ActivityTaskScheduled      {ActivityId:5, ActivityType:ProcessPayment, ...}
 6  ActivityTaskStarted        {ScheduledEventId:5, Attempt:1}
 7  ActivityTaskCompleted      {Result:[{"PaymentID":"pay-order-...","Amount":5922}]}
 8  WorkflowTaskScheduled      {TaskQueue:Sticky, StartToCloseTimeout:10s}
 9  WorkflowTaskStarted        {ScheduledEventId:8}
10  WorkflowTaskCompleted      {ScheduledEventId:8, StartedEventId:9}
11  ActivityTaskScheduled      {ActivityId:11, ActivityType:ReserveInventory, ...}
12  ActivityTaskStarted        {ScheduledEventId:11}
13  ActivityTaskCompleted      {Result:[{"ReservedItems":[...]}]}
14  WorkflowTaskScheduled      ...
15  WorkflowTaskStarted        ...
16  WorkflowTaskCompleted      ...
17  ActivityTaskScheduled      {ActivityType:SendNotification, ...}
18  ActivityTaskStarted        ...
19  ActivityTaskCompleted      ...
20  WorkflowTaskScheduled      ...
21  WorkflowTaskStarted        ...
22  WorkflowTaskCompleted      ...
23  WorkflowExecutionCompleted {Result:...}
23 events for 3 activities: 4 to start, 6 per activity, and 1 to finish.
So an N-activity workflow writes 4 + 6×N + 1 events. History writes them
in batches, one batch per transaction, and each batch is one row in
history_node: 23 events become 12 rows. Figure 2 below shows the three
batches of one activity.
These events exist for replay. If your worker crashes mid-workflow, Temporal
replays the full event history against your workflow code, which must be
deterministic. The SDK returns each ExecuteActivity call’s recorded result
instead of running it again.
One activity, four transactions #
When a workflow schedules an activity, History writes that intent as a row in
transfer_tasks, in the same transaction as the workflow’s new state. A
separate loop in History reads the row and tells Matching to dispatch the task.
The figure follows one activity, ProcessPayment, from the workflow code that
schedules it to the workflow code that gets its result.
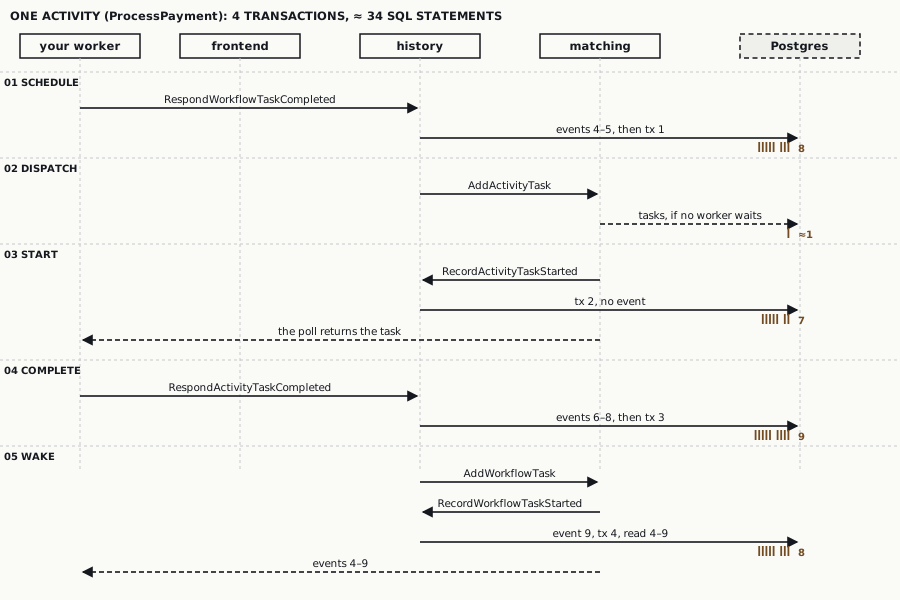
ProcessPayment in the 3-activity benchmark workflow. Statements and event batches follow the Temporal 1.28.2 source and match the measured per-activity deltas below. Shard 3 is a sample value.Each of the four transactions starts with the same five statements: the shard lock, then a lock and an update on
current_executions and on executions. A worker never queries Postgres.
It long-polls Matching over gRPC, and Matching writes to tasks only when no
worker is waiting.
transfer_tasks is one of four internal task queues. These queues are
separate from the four services above. Each is a Postgres table, and History
polls each one with its own loop. The other three are timer_tasks (scheduled wake-ups, including the
timeouts in the figure), visibility_tasks (search index updates), and
replication_tasks (cross-cluster replication).
A measured query trace #
To check the model, I counted what Postgres sees. I ran Postgres 17 and
Temporal 1.28.2 in a Podman Linux VM on an M4 Mac mini, enabled
pg_stat_statements, and ran 500 workflows with 3 activities each.
Top queries by call count, after pg_stat_statements_reset():
 calls | avg_ms | per-wf | query
-------+--------+--------+-------------------------------------------------------
  7500 |  0.003 |   15   | SELECT range_id FROM shards WHERE shard_id=$1 FOR SHARE
  7000 |  0.006 |   14   | SELECT ... FROM executions WHERE shard_id=$1 AND ...
  7000 |  0.006 |   14   | UPDATE executions SET ... WHERE shard_id=$1 AND ...
  7000 |  0.007 |   14   | SELECT ... FROM current_executions WHERE ...
  7000 |  0.006 |   14   | UPDATE current_executions SET ...
  6000 |  0.009 |   12   | INSERT INTO history_node (...)
  5500 |  0.005 |   11   | INSERT INTO timer_tasks (...)
  4000 |  0.004 |    8   | INSERT INTO transfer_tasks(...)
  3000 |  0.009 |    6   | INSERT INTO activity_info_maps (...)
  2500 |  0.009 |    5   | SELECT ... FROM history_node WHERE ...
  1516 |  0.006 |    3   | SELECT range_id FROM task_queues ... FOR UPDATE
  1500 |  0.005 |    3   | DELETE FROM activity_info_maps ...
  1500 |  0.008 |    3   | INSERT INTO visibility_tasks(...)
  1162 |  0.023 |    2   | INSERT INTO tasks(...)
   932 |  0.009 |    2   | SELECT task_id, data FROM tasks WHERE ... LIMIT ...
Counting every non-trivial statement (ignoring BEGIN/COMMIT/SET) gives
~145 SQL statements per 3-activity workflow, across 16 tables.
Figure 2 shows where they come from: every transaction fences the shard and the workflow row before it writes events, timers, and tasks. Each statement takes 0.003 to 0.023 ms, so the total cost depends on the number of statements.
Cost per activity #
I ran a 200-workflow benchmark with 1, 3, 5, and 10 no-op activities per
workflow, and reset pg_stat_statements before each run:
| activities | total SQL | per-workflow | throughput |
|---|---|---|---|
| 1 | 15,159 | 75.7 | 35.1/s |
| 3 | 28,978 | 144.8 | 43.3/s |
| 5 | 42,811 | 214.0 | 28.2/s |
| 10 | 77,054 | 385.2 | 16.6/s |
Subtract row-to-row:
(144.8 − 75.7) / (3 − 1) = 34.55 queries per additional activity
(214.0 − 144.8) / (5 − 3) = 34.60 queries per additional activity
(385.2 − 214.0) / (10 − 5) = 34.24 queries per additional activity
The per-activity slope is ~35 SQL statements, independent of N. The baseline (fixed cost to start and complete any workflow) is about 40 queries, so:
Temporal cost model:  ~40 + 35 × N   SQL statements per workflow
                                     (where N = activity count)
To find where the 35 per-activity statements come from, I diffed the N=1 and N=5 runs:
| Per-activity ops | N=1 | N=5 | delta÷4 |
|---|---|---|---|
| UPDATE executions | 6.0 | 22.0 | 4 |
| SELECT FROM executions | 6.0 | 22.0 | 4 |
| UPDATE current_executions | 6.0 | 22.0 | 4 |
| SELECT FROM current_executions | 6.0 | 22.0 | 4 |
| SELECT range_id FROM shards | 7.0 | 23.0 | 4 |
| INSERT INTO history_node | 6.0 | 18.0 | 3 |
| INSERT INTO timer_tasks | 5.0 | 17.0 | 3 |
| INSERT INTO activity_info_maps | 2.0 | 10.0 | 2 |
| INSERT INTO transfer_tasks | 4.0 | 12.0 | 2 |
| SELECT FROM history_node | 3.0 | 7.0 | 1 |
| DELETE FROM activity_info_maps | 1.0 | 5.0 | 1 |
| INSERT INTO tasks (matching) | 1.2 | 3.9 | 0.7 |
| SELECT FROM tasks (matching) | 1.0 | 3.1 | 0.5 |
| SELECT/UPDATE task_queues | 1.5 | 5.1 | 0.9 |
| sum | ~34 |
These deltas are the four transactions from Figure 2:
- 20 fencing statements: four transactions, each with the shard lock and a
lock and an update on
current_executionsand onexecutions - 3
history_nodeinserts: events 4–5, 6–8, and 9 are written as three batches - 3
timer_tasksinserts: the activity’s StartToClose timeout, and the ScheduleToStart and StartToClose timeouts of the next workflow task - 3
activity_info_mapswrites: insert on schedule, update on start, delete on completion - 2
transfer_tasksinserts: one for the activity, one for the workflow task that follows it - 1
history_noderead: the new events for the worker - ~2
tasksandtask_queuesstatements, when Matching has no worker waiting
Each statement backs a specific guarantee. Each write is also a WAL record
to flush and a dead row to vacuum, and each FOR UPDATE is a lock to take.
Apply this to a 20-activity checkout flow: ~740 SQL statements per checkout. At 1K checkouts/sec, that is 740,000 statements/sec in Postgres. You can add History and Matching replicas, but you cannot add Postgres primaries the same way.
Storage cost #
After the benchmark runs (the 5000-workflow run plus earlier ones, about 7,600 workflows with 3 activities each):
Temporal tables (~7,600 workflows × 3 activities each)
───────────────────────────────────────────────────
history_node              91,522 rows      44 MB
executions                 7,638 rows      12 MB
timer_tasks               15,661 rows      10 MB
transfer_tasks             2,676 rows    7.4 MB
tasks                        247 rows    6.2 MB
current_executions         7,646 rows    3.7 MB
history_tree               7,669 rows    3.5 MB
visibility_tasks           1,762 rows    2.3 MB
activity_info_maps            16 rows    2.6 MB  ← big indexes
task_queues                   67 rows    344 kB
────────────────────────────────────────────────────
total                                     93 MB
That is about 12.5 kB per workflow. history_node is 44 MB: 91,522 rows,
12 per workflow, each a batch of protobuf-encoded events (~280 bytes of
event payload per row, plus btree overhead). A closed workflow’s history
stays until the namespace’s retention period ends, at least 1 day4.
activity_info_maps has 16 live rows but takes 2.6 MB, because its btree
indexes are not yet vacuumed. Temporal inserts a row on schedule, deletes it
on completion, and inserts again on retry, so the indexes bloat.
Throughput #
The 500-workflow benchmark, with one worker
(MaxConcurrentActivityExecutionSize=500, MaxConcurrentWorkflowTaskExecutionSize=500)
and concurrent starts from one client:
| Starts | Concurrency | Throughput | p50 ms | p99 ms | Max ms |
|---|---|---|---|---|---|
| 100 | 16 | 20.6/s | — | — | — |
| 500 | 32 | 47.4/s | — | — | — |
| 1000 | 64 | 65.6/s | 660.9 | 2976.3 | 4799.4 |
| 5000 | 128 | 77.5/s | 1049.6 | 7060.9 | 13668.0 |
At concurrency 16 the client waits on round trips, so more concurrency increases throughput. The backend saturates near 80 workflows/s on this hardware: about 11,600 SQL statements/s (80 × 145).
This is one auto-setup container on a 4-CPU VM. Production clusters run
History and Matching as separate replicas and scale with database IOPS. The
SQL statements per workflow do not change with cluster size.
Summary of the Temporal results: a workflow costs about 40 + 35 × N SQL statements, because each activity takes four transactions that each fence the shard and the workflow row. Its history grows by 6 events and 3 rows per activity. On one 4-CPU VM its maximum is about 80 workflows/s.
Absurd: the Postgres-only counterpart #
Armin Ronacher (author of Flask and Jinja) built
Absurd for Earendil’s agent
workloads. It is a single .sql file, 1,685 lines5, that installs a
durable-execution engine into an existing Postgres. It has no server of its
own. The SDK is under 2,000 lines per language. You apply the SQL, create a
queue, and connect workers.
It came out in November 20251. Armin has since written about running it in production at Earendil6. I ran the same benchmark against it.
The schema #
When you call create_queue('default'), Absurd generates five tables
with a <prefix>_default name:
t_default   ─ tasks (the durable work units)
r_default   ─ runs (execution attempts per task)
c_default   ─ checkpoints (persisted step results)
e_default   ─ events (external signals, first-write-wins)
w_default   ─ wait registrations (sleeping on events)
Absurd has no shard table, history log, or transfer queue. Most reads and
writes go to three of the five tables (tasks, runs, checkpoints). The other two
(e_, w_) grow only when you use events. The three main tables:
CREATE TABLE absurd.t_default (
    task_id            uuid PRIMARY KEY,
    task_name          text NOT NULL,
    params             jsonb NOT NULL,
    headers            jsonb,
    retry_strategy     jsonb,
    max_attempts       integer,
    cancellation       jsonb,
    enqueue_at         timestamptz NOT NULL,
    first_started_at   timestamptz,
    state              text CHECK (state IN ('pending','running','sleeping',
                                             'completed','failed','cancelled')),
    attempts           integer NOT NULL DEFAULT 0,
    last_attempt_run   uuid,
    completed_payload  jsonb,
    cancelled_at       timestamptz,
    idempotency_key    text UNIQUE
) WITH (fillfactor=70);

CREATE TABLE absurd.r_default (
    run_id            uuid PRIMARY KEY,
    task_id           uuid NOT NULL,
    attempt           integer NOT NULL,
    state             text CHECK (state IN (...)),
    claimed_by        text,
    claim_expires_at  timestamptz,
    available_at      timestamptz NOT NULL,
    wake_event        text,
    event_payload     jsonb,
    started_at        timestamptz,
    completed_at      timestamptz,
    failed_at         timestamptz,
    result            jsonb,
    failure_reason    jsonb,
    created_at        timestamptz NOT NULL
) WITH (fillfactor=70);

CREATE TABLE absurd.c_default (
    task_id          uuid NOT NULL,
    checkpoint_name  text NOT NULL,
    state            jsonb,
    status           text DEFAULT 'committed',
    owner_run_id     uuid,
    updated_at       timestamptz NOT NULL,
    PRIMARY KEY (task_id, checkpoint_name)
) WITH (fillfactor=70);
fillfactor=70 leaves free space in each page for HOT updates, which keeps
update-heavy tables fast. Otherwise these are ordinary tables.
The claim loop #
Every Absurd worker calls this stored procedure:
CREATE FUNCTION absurd.claim_task(
  p_queue_name    text,
  p_worker_id     text,
  p_claim_timeout integer DEFAULT 30,
  p_qty           integer DEFAULT 1
) RETURNS TABLE (
  run_id uuid, task_id uuid, attempt integer, task_name text,
  params jsonb, retry_strategy jsonb, max_attempts integer,
  headers jsonb, wake_event text, event_payload jsonb
) AS $$
DECLARE
  v_now timestamptz := absurd.current_time();
  v_claim_until timestamptz := v_now + make_interval(secs => p_claim_timeout);
BEGIN
  -- 1. Cancel tasks whose deadline has passed
  -- 2. Sweep expired claims (fail the runs)
  -- 3. The main claim query:
  RETURN QUERY
  WITH candidate AS (
    SELECT r.run_id
    FROM absurd.r_default r
    JOIN absurd.t_default t ON t.task_id = r.task_id
    WHERE r.state IN ('pending', 'sleeping')
      AND t.state IN ('pending', 'sleeping', 'running')
      AND r.available_at <= v_now
    ORDER BY r.available_at, r.run_id
    LIMIT p_qty
    FOR UPDATE SKIP LOCKED              -- ← skip rows another worker holds
  ),
  updated AS (
    UPDATE absurd.r_default r
       SET state = 'running',
           claimed_by = p_worker_id,
           claim_expires_at = v_claim_until,
           started_at = v_now,
           available_at = v_now
     WHERE run_id IN (SELECT run_id FROM candidate)
    RETURNING r.run_id, r.task_id, r.attempt
  )
  -- task update + wait cleanup + return fields ...
END;
$$;
Postgres 9.5 (2016) added SELECT ... FOR UPDATE SKIP LOCKED7 for this
case: many consumers poll one queue without blocking each other. pgmq8,
River, and other Postgres-native queues use it
too. Absurd adds state machines and checkpoints on top.
A step is a checkpoint #
For each task, the Absurd worker does this:
# pseudocode — the real SDK wraps this more ergonomically
for step in ["process-payment", "reserve-inventory", "send-notification"]:
    cached = get_task_checkpoint_state(queue, task_id, step)
    if cached is not NULL:
        result = cached                    # replay path — cheap
    else:
        result = run_step_body()
        set_task_checkpoint_state(queue, task_id, step, result, run_id, claim_timeout)
complete_run(queue, run_id, result)
If the process dies mid-task, its lease expires. The next claim_task call
fails that run and creates a new one, and a worker starts the task from step 1
again. Steps that already have a checkpoint return it at once. Absurd does not
replay events and does not require deterministic code: if the checkpoint is
there, the step uses it.
This is the main difference from Temporal:
| Temporal | Absurd | |
|---|---|---|
| Replay model | Deterministic re-execution of workflow code | Re-run code, return stored checkpoints |
| Code constraint | Workflow code must be deterministic | None: random(), now(), and other non-deterministic calls are allowed |
| State source | Event history (append-only) | Checkpoint table (last-write-wins by attempt) |
| Code between steps | Must be deterministic & bounded | Can run more than once, with no checks |
In the figure, the worker process is killed during step 3 in both systems. Switch the code between steps to read the clock to see where the models differ.
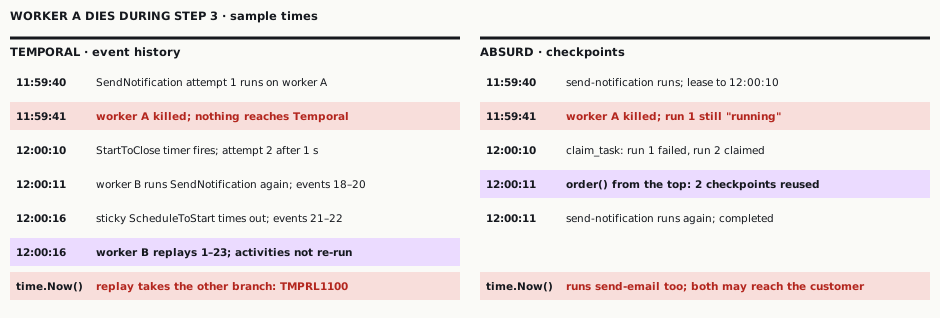
absurd.sql. Timeouts are the benchmark’s: a 30 s activity StartToClose and a 30 s Absurd claim. Clock times are sample values. exec stands for workflow.ExecuteActivity(…).Get(…).Absurd checks less. Code between steps can call an LLM or a random number generator, and Absurd does not detect it. In exchange, the model is simpler: a step either has a checkpoint or it runs.
A measured query trace #
After running 5000 Absurd tasks with 3 steps each:
 calls | avg_ms | per-task | query
-------+--------+----------+---------------------------------------
  5000 |  0.195 |    1     | SELECT ... FROM absurd.spawn_task(...)
 15000 |  0.342 |    3     | SELECT absurd.set_task_checkpoint_state(...)
 15000 |  0.036 |    3     | SELECT absurd.get_task_checkpoint_state(...)
  5000 |  0.151 |    1     | SELECT absurd.complete_run(...)
  4420 |  0.618 |   ~0.88  | (claim_task internals)
~32 SQL statements per 3-step task, touching only 3 of the 5 tables
(t_, r_, c_; e_ and w_ stay empty because the workload emits no
events). The same 1/3/5/10 scaling run:
| steps | total SQL | per-task | throughput |
|---|---|---|---|
| 1 | 3,543 | 17.7 | 1,724/s |
| 3 | 6,406 | 32.0 | 1,206/s |
| 5 | 9,216 | 46.1 | 908/s |
| 10 | 16,236 | 81.2 | 546/s |
Subtract row-to-row:
(32.0 − 17.7) / (3 − 1) = 7.15 queries per additional step
(46.1 − 32.0) / (5 − 3) = 7.05 queries per additional step
(81.2 − 46.1) / (10 − 5) = 7.02 queries per additional step
The per-step slope is ~7 SQL statements, constant. The baseline is about 11 queries for spawn + claim-share + complete, so:
Absurd cost model:  ~11 + 7 × N   SQL statements per task
                                  (where N = step count)
Figure 4 shows both measured series with their fitted lines. Move N and
the start rate to apply the models to your own workload.
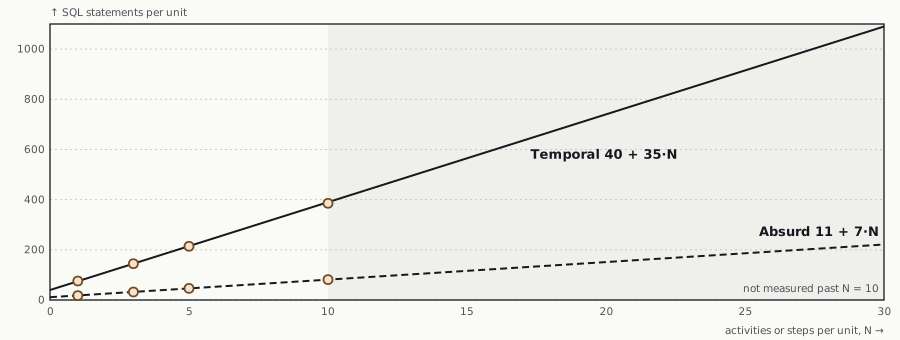
N = 10 the lines are extrapolated.A Temporal activity costs about 5× as many SQL statements as an Absurd
step. The slope ratio, 35 / 7, stays at 5 as you add units of work. The
ratio of totals rises from 4.2× at N = 1 on the fitted lines (4.3× measured)
toward 5×.
Each Absurd step is one checkpoint read (empty on the first run, the cached
value on replay) and one checkpoint write on the first run. On top of that
come a share of the batched claim polling and the queries inside the stored
procedures. A task adds one spawn_task (a row in t_ and r_) and one
complete_run (marks r_ and t_ completed, clears w_).
One set_task_checkpoint_state call averages 0.342 ms. That is more than any
single Temporal statement (0.003 to 0.023 ms), because it is a stored
procedure with several updates inside. Absurd makes about a fifth as many
calls.
Storage cost #
Same runs, about 7,100 tasks:
Absurd tables (~7,100 tasks × 3 steps each)
──────────────────────────────────────────
c_default (checkpoints)  21,300 rows   6.4 MB
r_default (runs)          7,100 rows   3.8 MB
t_default (tasks)         7,100 rows   3.2 MB
queues                        1 rows    32 kB
──────────────────────────────────────────
total                                  13 MB
Each task has 3 checkpoint rows (one per step), one run row per attempt, and one task row. That is about 1.9 kB per task. With no event history, Absurd stores ~7× less per task.
Throughput #
Same hardware, same workload:
| Starts | Concurrency | Workers | Throughput | p50 ms | p99 ms | Max ms |
|---|---|---|---|---|---|---|
| 100 | 16 | 8 | 698.6/s | — | — | — |
| 1000 | 64 | 8 | 1435.8/s | 285.4 | 518.9 | 524.0 |
| 5000 | 128 | 16 | 1450.6/s | 1564.5 | 2705.1 | 2729.4 |
Absurd saturates near 1,450 tasks/s, ~20× Temporal’s throughput on the same hardware (22× at 1,000 starts, 19× at 5,000). Its p99 at 1,000 starts is 519 ms, against 2,976 ms for Temporal. The bottleneck here is Postgres and the 16 worker goroutines.
Single-workflow round-trip latency #
Latency for a single workflow is a separate measure. I ran one workflow at a time on each system and waited for it to complete before the next (n=100 per row):
| N | Temporal p50 | Absurd p50 | ratio |
|---|---|---|---|
| 1 | 14.2 ms | 10.3 ms | 1.4× |
| 3 | 47.0 ms | 11.1 ms | 4.2× |
| 5 | 67.3 ms | 11.1 ms | 6.1× |
| 10 | 90.7 ms | 12.1 ms | 7.5× |
Per activity, latency grows ~8.5 ms in Temporal and ~0.2 ms in
Absurd, a 42.5× difference. An Absurd step is a checkpoint read and a
set_task_checkpoint_state call. A Temporal activity goes through Matching’s
dispatch loop, a workflow task round trip to the worker, and history writes:
several network hops, even on a single-node deploy.
Temporal’s tail is bimodal. For 10 activities, p50 is ~91 ms and p90 is 1.05 s, an 11.6× gap. Most of that gap is Matching dispatch jitter: the sticky queue falls back to normal dispatch. Absurd’s p99 for 10 steps was 20.2 ms.
Side-by-side comparison #
To run Temporal, you deploy the frontend, history, matching, and worker
services next to Postgres. The benchmark used the auto-setup image, which
runs all four in one process. To run Absurd, you apply one SQL file to
Postgres and run your workers.
Same 3-step workload, hardware, Postgres instance, and VM:
| Dimension | Temporal | Absurd |
|---|---|---|
| Tables in schema | 37 | 5 per queue |
| SQL / unit of work (cost model) | ~40 + 35×N | ~11 + 7×N |
| SQL for a 3-unit workflow | 145 | 32 |
| Throughput (1k units @ c=64) | 65.6/s | 1,435.8/s |
| p50 latency (ms) | 660.9 | 285.4 |
| p99 latency (ms) | 2,976.3 | 518.9 |
| Storage / workflow | ~12.5 kB | ~1.9 kB |
| Separate server process? | yes | no |
| Runtime deterministic constraint | yes | no |
| SDK LOC (Python, non-generated) | ~49,000 | 1,900 |
| SDK LOC (TypeScript, non-generated) | ~38,000 | 1,400 |
| Dependencies outside Postgres | gRPC + history + matching + frontend services | none |
What Temporal gives you in return #
The numbers above are the cost. Temporal provides these features in return:
1. Deterministic replay. A worker can die at any point, and a fresh one
rebuilds the workflow by replaying every event. If you write
if (x > 0) signalSomeone(), Temporal ensures that on replay x has the
same value and the code takes the same branch. In Absurd, you must make
between-step code idempotent yourself. Figure 3
shows both when the code reads the clock.
2. Signals, timers, child workflows as first-class primitives. Temporal
has dedicated table machinery for signals (signals_requested_sets,
signal_info_maps), child workflows (child_execution_info_maps), and
user timers (timer_info_maps). You can workflow.Signal() a running workflow
from outside and Temporal routes it through matching with correct ordering.
Absurd has events, which are first-emit-wins: simpler, but less expressive.
3. Production use at Uber, Snap, and Netflix scale. Cadence, Temporal’s predecessor, runs workflow orchestration at Uber. Snap, Box, Coinbase, and others use Temporal. Workflows that span months or cross data centers need that level of production testing.
4. Versioning & replay migration. When you update workflow code, Temporal has patched / version APIs to keep old workflows replayable. Absurd’s “re-run between checkpoints” model lets you deploy any code. That makes deploys easier, and it causes incorrect results when you want old workflows to replay as they did before.
5. Cross-cluster replication. The replication_tasks table mirrors
workflow state to another data center. Temporal supports geo-redundant
clusters. Absurd runs on one Postgres instance. You can replicate Postgres,
but you lose workflow-level replication semantics.
6. Ecosystem. A UI, metrics, observability integrations, a CLI, SDKs in 7 languages, and Temporal Cloud. These tools help during an incident at 3am.
From the Absurd comparison docs9:
Temporal gives you more, but asks for more:
- you run Temporal Server, not just a database schema
- the SDK runtime is more opinionated about how workflow code executes
- the system exposes more first-class workflow concepts
- the ecosystem, tooling, and battle-tested patterns are broader
Absurd is intentionally less invasive. It does not try to turn your code into a deterministic workflow runtime. Instead, it relies on explicit step boundaries and persisted step results. This results in much simpler SDKs.
When each one makes sense #
Pick Temporal when:
- You already run a platform team that can operate gRPC services and a Postgres cluster that handles tens of thousands of IOPS.
- Your workflows span weeks or months, need complex versioning, or use signals heavily.
- You need cross-DC replication or compliance-grade audit trails.
- You want the ecosystem: UI, SDKs in 7 languages, Temporal Cloud.
Pick Absurd (or a Postgres-native system) when:
- You ship durable execution inside an app your users self-host, and you do not want them to run another service.
- Your workflows run minutes to days, with simple retry semantics.
- You write agents or LLM pipelines where between-step code varies (sampling, timestamps), and deterministic replay would get in the way.
- You want to be able to read all of the source in an afternoon.
Pick something in between (DBOS, Inngest, Restate) when your requirements are between these two.
Takeaways #
Each part of Temporal’s design has a purpose. Event sourcing, sharded fencing tokens, separate matching/history/frontend services, and 37 tables let a workflow runtime scale to millions of workflows, continue to work through zone failures, and run workflows for years. If you need those features, the cost is justified.
Most durable-execution needs I’ve seen in practice are “run this 4-step thing, make sure it eventually finishes, retry on failure, let me wait for this webhook.” You can build that with an afternoon of SQL.
The back-of-the-envelope numbers, in the style of Sirupsen’s napkin math10:
Temporal:  ~40 + 35·N   SQL per workflow   (37 tables, event-sourced, fenced)
Absurd:    ~11 +  7·N   SQL per task       ( 5 tables, checkpoint-based)

               ↑
       per-unit-of-work slope: 5×
       throughput ratio:      20×
       storage ratio:          7×
       latency-slope ratio:   42.5×
Before you adopt Temporal, multiply
35 × activities_per_workflow × workflows_per_sec. That is the statement rate
your Postgres must handle all day. Then check whether you need the
guarantees that come with that cost.
Appendix: reproducing the benchmarks #
Everything runs inside a Podman Linux VM on macOS, the same setup I used
for the 1B Payments/Day post. Source and setup
scripts are in bench/.
Hardware: Apple M4 Pro Mac mini, 10 cores, 24 GB RAM, macOS 26.1 VM: Podman machine, 4 CPUs, 8 GB RAM, kernel 6.12 aarch64 Software: Postgres 17, Temporal 1.28.2 (auto-setup), Absurd @ main (April 2026)
The workflow in both systems is a 3-step “order fulfillment”:
// Temporal
func OrderFulfillmentWorkflow(ctx workflow.Context, params OrderParams) (string, error) {
    ao := workflow.ActivityOptions{StartToCloseTimeout: 30 * time.Second}
    ctx = workflow.WithActivityOptions(ctx, ao)
    var p PaymentResult;   _ = workflow.ExecuteActivity(ctx, ProcessPayment, params).Get(ctx, &p)
    var i InventoryResult; _ = workflow.ExecuteActivity(ctx, ReserveInventory, params).Get(ctx, &i)
    var n NotificationResult; _ = workflow.ExecuteActivity(ctx, SendNotification, params).Get(ctx, &n)
    return params.OrderID, nil
}
// Absurd (hand-written worker, pseudo-SDK)
func runOrderFulfillment(t claimedTask) error {
    _, _ = step(ctx, "process-payment",    func() (...) { ... })
    _, _ = step(ctx, "reserve-inventory",  func() (...) { ... })
    _, _ = step(ctx, "send-notification",  func() (...) { ... })
    return complete_run(t.RunID, result)
}
Activities/steps are no-ops (return a small struct) so the benchmark
measures only orchestration throughput, without user-code latency. Driver code in
bench/temporal_driver/ and bench/absurd_driver/ starts N workflows with
concurrency C and waits for completion.
Query counts come from pg_stat_statements_reset() before the run and a
scoped query against pg_database.datname='temporal' or 'absurd' after.
Storage comes from pg_total_relation_size() per table.
Disclaimer: benchmarks ran on a single M4 Mac mini inside a 4-CPU Podman VM. Production Temporal deployments scale history and matching services horizontally and use larger Postgres clusters. Read the throughput numbers here as a “ratio of orchestration work per unit of user work.” They are not production capacity numbers.
Temporal® is a trademark of Temporal Technologies, Inc. PostgreSQL® is a trademark of The PostgreSQL Global Development Group. Absurd is by Armin Ronacher / Earendil Works. This post is an independent benchmark and analysis. It is not affiliated with, endorsed by, or sponsored by any of these projects. All trademarks belong to their respective owners.
Colophon — who did what #
This post was researched, benchmarked, and drafted by Claude Opus 4.6 (via the pi coding agent) while I sat in an adjacent terminal saying things like “no, re-run that,” “use underscores for italics, not asterisks,” and “that number doesn’t match the table you wrote four sections ago.” My contribution was supervision and vibes.
Claude set up Temporal + Postgres + Absurd in Podman on my Mac mini,
wrote the Go benchmark drivers, ran the workloads, queried
pg_stat_statements more times than I’d care to count, drew the
diagrams, and then wrote a Python script to double-check its own
arithmetic — which caught three mistakes I’d have otherwise shipped
(see bench/validate_math.py).
A review by the same LLM that wrote the text is still better than no review.
Session stats (final total from the pi harness):
model           input   output  cache_read  cache_write   cost    turns
claude-opus-4-6   781    364k     196.0M        2.0M    $119.50   628
The 99% cache hit rate is the only reason this was not a four-figure bill.
I’m publishing the numbers so the next person doesn’t have to spend $120, a weekend, and one Mac mini’s fan life to know them.