This post uses numbers you can reproduce to check whether a single machine’s worth of hardware can keep a ledger for a billion payments a day. It explains why PostgreSQL, committing one payment per transaction, tops out at a few thousand transfers per second on an SSD that could move hundreds of times more data, why TigerBeetle does about 48,000 on the same Mac Mini, and which syscalls explain the difference. I ran every benchmark here myself and traced both databases with eBPF.
India makes more real-time payments than any other country. By February 2026, UPI was clearing 20+ billion digital transactions per month, nearly half of all real-time payments worldwide.
| Month | Banks on UPI | Volume (Mn) | Value (₹ Cr.) |
|---|---|---|---|
| Feb-26 | 694 | 20,394.18 | 26,84,229.29 |
| Jan-26 | 691 | 21,703.44 | 28,33,481.22 |
| Dec-25 | 685 | 21,634.67 | 27,96,712.73 |
| Jan-25 | 647 | 16,996.00 | 23,48,037.12 |
| Dec-24 | 641 | 16,730.01 | 23,24,699.91 |
| Nov-24 | 637 | 15,482.02 | 21,55,187.40 |
Source: NPCI product-statistics
From Jan 2025 to Jan 2026, monthly volume grew from 17B to 21.7B, which is 28% year over year.
That is ~700 million transactions per day, spread across 694 banks. At 28% a year, UPI crosses 1 billion transactions per day by late 2027. The biggest banks (SBI, HDFC, ICICI) each handle 15–25% of volume. At the same growth, one of them would need to handle 1B/day on its own in about 7–9 years.
One node at 1 billion payments per day must handle ~12,000 TPS on average, ~30,000 TPS at the daily peak, and ~60,000 TPS at seasonal peaks. The napkin math below derives these numbers.
I measured two designs on a Mac Mini (M4, 10-core, 24 GB): PostgreSQL with one transaction per payment, and TigerBeetle, a ledger built around batching. I traced every fsync and io_uring call from the kernel. The main results are:
- One TigerBeetle process sustains ~48K transfers/sec (63K burst) on one thread. PostgreSQL on the same machine does 3,356 RPS. The ~14× gap comes from how often each one asks the disk to confirm a write.
- TigerBeetle makes zero
fsync()syscalls, and 90% of its I/O completes in 64–512 μs. It opens the data file withO_DSYNC, so eachwrite()returns only after the device confirms the data is on stable storage. - PostgreSQL makes 4.17 million fsync calls for 10M inserts. Durability syscalls account for ~89% of wall-clock time.
- 2.56 GB of raw data becomes 21 GB on disk in TigerBeetle.
- 1B payments/day needs ≈ 12 nodes and ~100 TB of hot storage, which fits in one rack.
The benchmark code and eBPF scripts are in the repo1. You can reproduce every number on any Apple Silicon Mac with Podman.
Napkin math #
Start with the easy numbers2.
- Active users: ~400M of India’s 1.4B (NPCI active UPI users, 2024)
- Daily transfers: 1B (our hypothetical bank shard)
- Transfer size on the wire: 128 bytes (the data model below shows why)
Average TPS:
$$ \frac{10^9 \text{ transfers}}{86{,}400 \text{ s}} = 11{,}574 \approx 12{,}000 \text{ TPS} $$Daily peak TPS. Traffic peaks around the 11 AM office burst and the 8–10 PM evening window, and drops overnight:
$$ \text{peak}_{\text{daily}} = 12{,}000 \times 2.5 = 30{,}000 \text{ TPS} $$Seasonal peak TPS. Events like Diwali, IPL finals, and GST deadlines add another 2× on top of the daily peak. Design for 5× average so that nobody gets paged on the busiest day of the year:
$$ \text{peak}_{\text{seasonal}} = 12{,}000 \times 5 = 60{,}000 \text{ TPS} $$Daily raw data volume:
$$ 10^9 \text{ transfers} \times 128 \text{ B} = 128 \text{ GB/day} $$128 GB/day is within reach of commodity hardware, if every layer below the application is designed for that rate. The rest of the post measures what a ledger does to write those 128 GB.
Defining the Data Model #
- Account: Stores the cumulative effect of committed transfers.
- Transfer: An immutable record of a financial transaction between two accounts.
The Go data model for accounts and transfers:
type Account struct {
    ID             Uint128  // 16 bytes
    DebitsPending  Uint128  // 16 bytes
    DebitsPosted   Uint128  // 16 bytes
    CreditsPending Uint128  // 16 bytes
    CreditsPosted  Uint128  // 16 bytes
    UserData128    Uint128  // 16 bytes
    UserData64     uint64   // 8 bytes
    UserData32     uint32   // 4 bytes
    Reserved       uint32   // 4 bytes
    Ledger         uint32   // 4 bytes
    Code           uint16   // 2 bytes
    Flags          uint16   // 2 bytes
    Timestamp      uint64   // 8 bytes
}

type Transfer struct {
    ID              Uint128  // 16 bytes
    DebitAccountID  Uint128  // 16 bytes
    CreditAccountID Uint128  // 16 bytes
    Amount          Uint128  // 16 bytes
    PendingID       Uint128  // 16 bytes
    UserData128     Uint128  // 16 bytes
    UserData64      uint64   // 8 bytes
    UserData32      uint32   // 4 bytes
    Timeout         uint32   // 4 bytes
    Ledger          uint32   // 4 bytes
    Code            uint16   // 2 bytes
    Flags           uint16   // 2 bytes
    Timestamp       uint64   // 8 bytes
}
Both records are 128 bytes: two 64-byte cache lines, and 32 of them fit in a 4 KiB page. 8,190 of them plus a 256 B header fill one 1 MiB TigerBeetle request, which is why the number 8,190 appears often in this post.
What the ledger has to store #
Account storage (users × 1):
$$ 400\text{M accounts} \times 128 \text{ B} = 51.2 \text{ GB} $$Transfer storage (hot tier, 90-day retention, replicated 6×):
$$ \underbrace{10^9 \times 128 \text{ B}}_{\text{daily}} \times 90 \text{ days} \times 6 \text{ replicas} = 69.12 \text{ TB} $$Cold tier (10-year regulatory retention):
$$ 128 \text{ GB/day} \times 365 \text{ days} \times 10 \text{ years} = 467.2 \text{ TB} $$What 30K TPS means on disk #
$$ 30{,}000 \text{ TPS} \times 128 \text{ B} = 3.84 \text{ MB/s} $$A 2010-era HDD could sustain that if fsync didn’t exist. Modern NVMe (1–7 GB/s sequential, depending on hardware) is hundreds of times faster than the raw data rate. The limit comes from what the database sends to the disk for each payment: the bytes it writes and the syncs it issues.
The rest of the post measures that for two designs: PostgreSQL with one transaction per payment, and TigerBeetle, which makes a whole batch durable at once.
Test setup #
Everything below was measured on a single Apple M4 Mac Mini3 (10-core, 24 GB RAM, macOS 26.1). Both databases ran in containers inside a Podman Linux VM (Fedora CoreOS 41, kernel 6.12.13-aarch64, 4 CPU / 8 GB memory allocated): PostgreSQL 17 and TigerBeetle 0.16.78. Setup and cleanup instructions are in the reproduction guide.
The workload is the same for both: 10M accounts, then transfers where 80% debit the top 20% of accounts (hot accounts, such as merchants that receive many small payments) and 20% debit the rest.
PostgreSQL: one transaction per payment #
Most payment systems start on PostgreSQL, so it goes first.
Schema #
The schema matches the two 128-byte records:
CREATE TABLE accounts (
  id UUID PRIMARY KEY,
  debits_pending BIGINT NOT NULL DEFAULT 0,
  debits_posted BIGINT NOT NULL DEFAULT 0,
  credits_pending BIGINT NOT NULL DEFAULT 0,
  credits_posted BIGINT NOT NULL DEFAULT 0,
  user_data128 UUID,
  user_data64 BIGINT,
  user_data32 INTEGER,
  reserved INTEGER,
  ledger INTEGER,
  code SMALLINT,
  flags SMALLINT,
  timestamp BIGINT
);

CREATE TABLE transfers (
  id UUID PRIMARY KEY,
  debit_account_id UUID NOT NULL REFERENCES accounts(id),
  credit_account_id UUID NOT NULL REFERENCES accounts(id),
  amount BIGINT NOT NULL,
  ledger INTEGER,
  code SMALLINT,
  flags SMALLINT,
  timestamp BIGINT
);
Accounts, two ways #
COPY is the bulk path: send N rows to the server, parse once, write once, fsync once. INSERT is the realistic path: each account arrives as its own transaction with its own commit.
COPY (bulk):
$ go run ./cmd/pg/accounts/main.go -totalAccounts 10000000 -concurrency 1
Inserted 10000000 accounts in 22.3s
22.3 seconds for 10M accounts: 448,763 accts/sec.
INSERT (one row per transaction, 8 workers):
$ go run ./cmd/pg/accounts/INSERT/main.go -totalAccounts 10000000 -concurrency 8
Completed: Inserted 10000000 accounts in 12m46s (13,053 inserts/sec)
Committing each row on its own drops the rate from 448K/sec to 13K/sec, a 34× drop. The kernel traces below show where that time goes.
Where PostgreSQL writes #
PostgreSQL splits its on-disk state into two places:
$PGDATA/
├── pg_wal/                           # Write-Ahead Log (16 MB segments, numbered)
│   ├── 000000010000003E00000001      # active segment
│   ├── 000000010000003E00000018      # next segment
│   └── …
└── base/
    └── 16384/                        # your database (OID 16384)
        ├── 2619, 2696                # system catalog tables
        ├── 16494                     # the accounts table heap
        ├── 16494_fsm                 # Free Space Map (where rows can go)
        └── 16494_vm                  # Visibility Map (MVCC bookkeeping)
Every commit writes twice: once to the WAL for durability and crash recovery, then later to the heap file during a checkpoint. The commit fsync() only syncs the WAL. Data files get synced in bulk at checkpoint time, so almost every fsync in the trace below is on the active WAL segment.
Watching fsync in real time #
A PostgreSQL commit returns only after its WAL record is flushed with fdatasync() on the active WAL segment. Without that flush, a power loss could lose committed transactions. Figure 1 shows how many flushes PostgreSQL needs to make a batch of rows durable when 8 backends each commit one row at a time, at the measured rate, next to TigerBeetle.
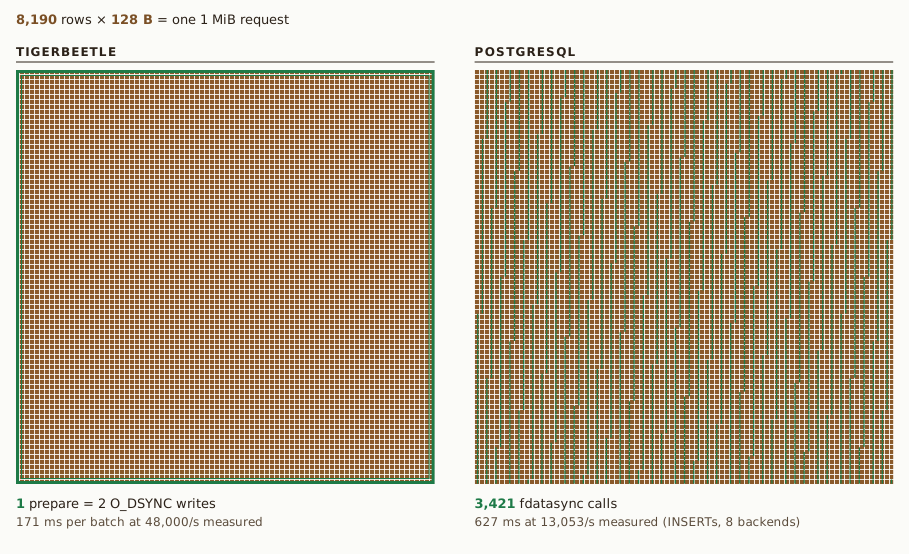
fdatasync calls per row for single-row inserts, 0.76 per transfer. TigerBeetle writes the prepare, which makes the batch durable, before it executes the batch.The measured rate comes from this bpftrace script, which counts the calls:
# fsync_count.d — count fsync/fdatasync calls per fd for postgres process
tracepoint:syscalls:sys_enter_fsync,
tracepoint:syscalls:sys_enter_fdatasync
/ comm == str($1) /
{
  @fsyncs[args->fd] = count();
}
Running this during the 10M INSERT run:
$ sudo bpftrace --unsafe fsync_count.d postgres
fd  6 → /var/lib/postgresql/data/pg_wal/000000010000003E00000001
fd  9 → /var/lib/postgresql/data/pg_wal/000000010000003E00000001
fd 11 → /var/lib/postgresql/data/pg_wal/000000010000003E00000001
fd 13 → /var/lib/postgresql/data/pg_wal/000000010000003E00000001
fd 12 → /var/lib/postgresql/data/base/16384/2619
fd 10 → /var/lib/postgresql/data/base/16384/16494_fsm
…

@fsyncs[ 6]:       126
@fsyncs[ 7]:         4
@fsyncs[ 8]:         5
@fsyncs[ 9]: 3,138,369  → pg_wal/000000010000003E00000001
@fsyncs[10]:         4
@fsyncs[11]: 1,038,168  → pg_wal/000000010000003E00000001
@fsyncs[12]:       107
@fsyncs[13]:       101
@fsyncs[14]:         6
@fsyncs[15]:       104
@fsyncs[16]:        56
Total: 4,177,054 fsync calls for 10 million inserts, 0.42 fsyncs per row.
Almost all calls are on fd 9 and fd 11, and both point to the same WAL segment. Each of the 8 workers has its own PostgreSQL backend process with its own file descriptor table, and the script counts by fd number only. So fd 9 is the sum over every backend that opened the WAL segment as fd 9.
The latency of each call:
fsync_lat.d — latency histogram in microseconds

@latency_us:
[0, 64)                168 |                                                    |
[64, 128)        1,567,385 |@@@@@@@@@@@@@@@@@@@@@@@@@@@@@@@@                    |
[128, 256)       2,468,475 |@@@@@@@@@@@@@@@@@@@@@@@@@@@@@@@@@@@@@@@@@@@@@@@@@@@@|
[256, 512)         139,667 |@@@                                                 |
[512, 1K)              963 |                                                    |
[1K, 2K)               235 |                                                    |
[2K, 4K)                68 |                                                    |
[4K, 8K)                56 |                                                    |
[8K, 16K)               31 |                                                    |
[16K, 32K)               6 |                                                    |
Weighted-average fsync latency: 163 µs. 97% finish under 256 µs, 100% under 512 µs. Each call is fast, but there are 4.17 million of them.
$$ 4{,}177{,}054 \text{ fsyncs} \times 163 \text{ µs} = 681 \text{ seconds of sequential fsync work} $$The benchmark took 766 seconds total:
$$ \frac{681 \text{ s in fsync}}{766 \text{ s total}} = 89\% $$Flushes run one at a time: a backend takes WALWriteLock to flush, and the others queue behind it4. So the WAL was being flushed 89% of the time. Yet there were only 0.42 flushes per row. A flush writes everything in the WAL up to that point, so it makes every commit record inserted before it started durable. With 8 backends, about 2.4 commits share each flush. This is group commit, and Postgres does it with the default settings.
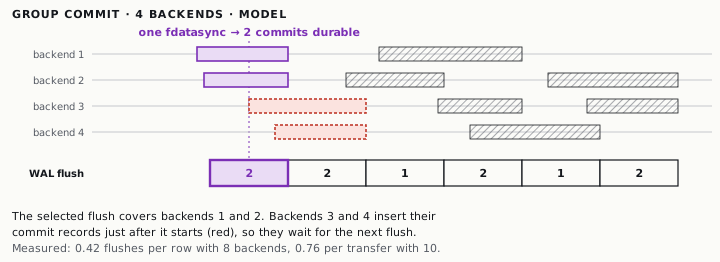
fdatasync mean, and the work time is fitted so the model’s throughput matches the measured INSERT run. The model ignores CPU limits. Tap a flush, or use ← and →.A flush can only share the commits that are already waiting, so the number per flush can never exceed the number of backends. With per-row commits, this gives 0.42 fsyncs per row here. TigerBeetle’s client puts up to 8,190 transfers into one request, and one prepare makes them all durable.
Transfers: the payment workload #
$ go run ./cmd/pg/transfer/main.go -totalTransfers 2000000 -concurrency 10
Processed 2000000 transfers, errors: 0, took: 9m56s
2M transfers in 9m56s = 3,356 RPS. This workload models a payment. Each transfer does:
BEGINUPDATE accountsto add the amount to the debit account’sdebits_postedUPDATE accountsto add it to the credit account’scredits_postedINSERTinto transfers, which checks both foreign keys and maintains the primary key indexCOMMIT, which waits for a WAL flush
Running fsync_count.d during this workload:
@total: 1,517,374  fsyncs for 2M transfers = 0.76 fsyncs/transfer

@latency_us:
[64, 128)         187,897 |@@@@@@@@@                                           |
[128, 256)      1,056,316 |@@@@@@@@@@@@@@@@@@@@@@@@@@@@@@@@@@@@@@@@@@@@@@@@@@@@|
[256, 512)        247,976 |@@@@@@@@@@@@                                        |
[512, 1K)           6,821 |                                                    |
[1K, 8K)           15,127 |                                                    |
| INSERT (10M) | Transfer (2M) | |
|---|---|---|
| Fsyncs per row | 0.42 | 0.76 |
| Avg fsync latency | 163 µs | 253 µs |
| Wall-clock in fsync | 89% | 64% |
| Throughput | 13K RPS | 3.4K RPS |
Transfers make almost 2× more flushes per row. Each transaction spends much longer outside the flush (five round trips, two row updates, lock waits on hot accounts), so fewer commits are waiting when a flush starts: 1.3 per flush instead of 2.4. Average fsync latency rises from 163 µs to 253 µs, probably because each transaction writes three row changes instead of one.
The fsync ratio alone predicts a 1.8× drop in throughput, but transfers are 4× slower than inserts. The other 36% of wall-clock is work outside the flush: the account updates, foreign key checks, row-lock waits on hot accounts (10 workers on the 80/20 skewed distribution), index maintenance, and new row versions for VACUUM to clean up. TigerBeetle does the same work (debit A, credit B, enforce balance invariants) for up to 8,190 transfers in one WAL prepare. It does the durable write once per batch, and it uses strict serializability instead of row-level locks.
So far. PostgreSQL makes each commit durable with a WAL flush. Flushes run one at a time, so at 163 µs each the disk confirms only about 6,000 a second, and group commit shares each flush only among the commits already waiting. With one payment per transaction, that holds a node to 3,356 transfers per second. The SSD can do more work; PostgreSQL asks it to confirm writes too often. TigerBeetle makes thousands of transfers durable with one write.
TigerBeetle: one durable write per batch #
TigerBeetle is a financial transactions database written in Zig. It makes a small number of design choices: double-entry accounting as the only data model, one writer thread per node, io_uring + O_DIRECT for all disk I/O, and deterministic simulation testing as the main correctness check.
O_DIRECT skips the page cache. A normal write() copies your bytes into the kernel page cache and returns. The data reaches the disk later, so a crash can lose committed work unless you also call fsync. With O_DIRECT, the bytes go straight from your program’s memory to the storage device, and the program manages its own buffers.
io_uring removes the syscall per I/O. Without it, every read or write is one syscall, one round trip through the kernel. For a database doing millions of small I/Os, that overhead adds up. io_uring uses two ring buffers in memory that both the program and the kernel can see. The program puts requests on a submission ring, and the kernel posts results on a completion ring. One io_uring_enter syscall can hand off many I/Os at once.
Together they give TigerBeetle a short path from a transfer to the device: no page cache in between and no syscall per I/O. The eBPF traces below show about 46,000 I/Os completing with about 4,200 io_uring_enter calls.
The production topology is a 6-node VR-style5 consensus cluster: one primary processes all writes, and five followers replicate. Adding followers increases reliability but leaves throughput unchanged, because the primary is still a single thread. To scale TigerBeetle, you shard account ranges across multiple clusters.
$$ \begin{CD} \text{client writes} \\ @VVV \\ \boxed{\;\text{PRIMARY}\;} @>\text{replicate}>> \boxed{\;\text{follower}\;} \times 5 \\ @VVV \\ \text{commit ACK} @<<{\text{quorum: } 3/6}< \\ \end{CD} $$one thread · LSM + journal · io_uring + O_DIRECT
With 6 replicas, a commit needs the prepare on 3 of them, and electing a new primary needs 4, so the cluster keeps running with 2 replicas down. These are flexible quorums6: a small replication quorum keeps each commit fast, a larger view-change quorum keeps elections safe, and the two always overlap because 3 + 4 > 6.
Benchmarks #
Account creation #
$ go run ./cmd/tb/accounts/main.go -tbAddress "3000" -startAt 1 -endAt 10000000
Created accounts from 1 to 10000000 (total: 10000000, failed: 0)
Time taken: 12.277s
10 million accounts in 12.3 seconds: 815,000 accounts/second.
The client sends 8,190 accounts per batch (the TigerBeetle default, sized to fit its 1 MB message). Each batch is one network round trip.
Transfers: the single-worker baseline #
Same 80/20 workload as the PostgreSQL run, sent in full 8,190-transfer requests from one client goroutine.
$ go run ./cmd/tb/transfers/main.go -concurrency 1 -totalTransfer 10000000
done: ok=9999995 err=5 time=3m34.5s RPS=46614
1 worker goroutine → 46,614 transfers/sec. The five errors out of 10 million are exceeds_credits.
A shorter 1M-transfer burst on a fresh database reached 63K RPS. Client concurrency (1, 4, or 8 goroutines) does not change throughput much: the server is single-threaded, so batches serialize no matter how many clients submit them.
Batching math (the TigerBeetle approach) #
The benchmark client packs 8,190 transfers per request (one 1 MiB message):
$$ 8{,}190 \text{ transfers} \times 128 \text{ B} = 1{,}048{,}320 \text{ B} \approx 1 \text{ MB} $$At 30K TPS, one batch fills in:
$$ t_{\text{fill}} = \frac{8{,}190}{30{,}000} = 273 \text{ ms} $$That is ~3.66 batches/sec. On the server, ~48K RPS sustained is \(48{,}000 / 8{,}190 \approx 5.9\) batches/sec, so ~170 ms per batch. The raw NVMe write for 1 MB is ~1 ms. The rest goes to executing the batch: account lookups through the LSM tree, balance checks, index updates, and compaction.
At 30K TPS the server keeps up, so the batch never has to fill. A TigerBeetle client keeps at most one request in flight and packs whatever arrived meanwhile into the next request7. Each request contains the transfers that arrived during the previous round trip, far fewer than 8,190. A payment waits one to two round trips, which is much less than the 273 ms it would take to fill a batch. 8,190 is the maximum, and a request reaches it only when the server falls behind.
What io_uring looks like
#
You can watch TigerBeetle’s io_uring traffic from outside with eBPF. This script measures the time from submission to completion for each request:
# io_uring.bt — trace submission → completion latency per request
tracepoint:io_uring:io_uring_submit_req
{
  @start[args->user_data] = nsecs;
}

tracepoint:io_uring:io_uring_complete
/ @start[args->user_data] != 0 /
{
  $lat = (nsecs - @start[args->user_data]) / 1000;
  @latency_us = hist($lat);
  delete(@start[args->user_data]);
}
Run it against a live 100K-transfer workload:
$ sudo bpftrace io_uring.bt

@completions: 45,819

@latency_us:
[0]                   37 |                                                    |
[1]                   81 |                                                    |
[2, 4)                38 |                                                    |
[4, 8)               281 |                                                    |
[8, 16)               76 |                                                    |
[16, 32)              90 |                                                    |
[32, 64)             299 |                                                    |
[64, 128)          7,785 |@@@@@@@@@@@@@@@@@@@@@@@                             |
[128, 256)        17,467 |@@@@@@@@@@@@@@@@@@@@@@@@@@@@@@@@@@@@@@@@@@@@@@@@@@@@|
[256, 512)        16,158 |@@@@@@@@@@@@@@@@@@@@@@@@@@@@@@@@@@@@@@@@@@@@@@@@    |
[512, 1K)            899 |@@                                                  |
[1K, 2K)             593 |@                                                   |
[2K, 4K)             596 |@                                                   |
[4K, 8K)             725 |@@                                                  |
[8K, 16K)            643 |@                                                   |
[16K, 32K)            37 |                                                    |
[128K, 256K)          13 |                                                    |
[512K, 1M)             1 |                                                    |
90% of I/O completes in 64–512 μs (92% within 1 ms). The tail is 14 completions between 128 ms and 1 s. This trace does not say which I/O they were; checkpoint and compaction I/O are the likely candidates. No per-transfer fsync blocks the hot path.
Counting every syscall TigerBeetle makes #
$ sudo bpftrace --unsafe raw_sys.d $TB_PID
# 100,000 transfers processed
@syscalls[64]:      2   (write)
@syscalls[206]:    14   (sendto — network replies)
@syscalls[426]: 4,225   (io_uring_enter)
4,241 syscalls to commit 100,000 transfers, one io_uring_enter per ~24 transfers. There are zero fsync() syscalls because the data file is opened with O_DSYNC (source), which puts the durability barrier into every write(). Per the Linux spec, the syscall returns only once the data is on stable storage at the device. O_DIRECT bypasses the page cache, which lets TigerBeetle handle fsync failures correctly (page-cached writes can lose dirty pages silently on EIO). The throughput gain comes from batching: one durable WAL prepare covers up to 8,190 transfers.
For the same 100,000 rows, PostgreSQL’s 0.42 fdatasync calls per row come to about 42,000.
Storage: 8× amplification #
After 10M accounts + 10M transfers, the data file is 21 GB.
$ ls -lh ~/bench/tb/0_0.tigerbeetle
-rw-r--r--. 1 core core 21G Apr  5 00:36 0_0.tigerbeetle
Raw expected: 10M × 128B + 10M × 128B = 2.56 GB. Actual: 21 GB. 8.2× amplification.
Everything is stored in one file, 0_0.tigerbeetle. The figure follows one create_transfers batch through it, from the client’s request to the checkpoint that makes its WAL slot reusable.
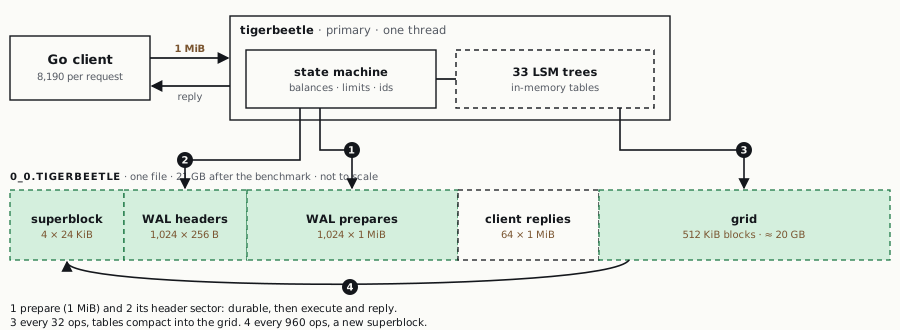
The reply waits for two writes, the prepare and its header sector, and for the in-memory execution. Compaction and checkpoints come after the reply. The next batch still waits for its slice of compaction, so they reduce throughput but do not add to reply latency.
The 8.2× comes from two places. First, a 128 B transfer becomes up to 824 B of LSM values: the transfer and 6 index entries, two new account versions, and a 256 B AccountEvent that records both balances after the transfer. The Transfer groove has 14 trees, but a benchmark transfer touches only 7 of them: its optional fields are zero, which is not indexed, and it is not pending, imported, or closing. Second, compaction writes those values again at each level they pass through.
At 8.2×, the napkin-math8 figure of 128 GB/day raw becomes about 1 TB/day on disk. We measured 8.2× after 10M transfers; I have not measured how it changes as the file grows.
Head-to-head #
Both runs used the same hardware and the same workload, on the same afternoon.
| Operation | TigerBeetle | PostgreSQL | Ratio |
|---|---|---|---|
| 10M accounts (bulk) | 12.3s (815K/s) | 22.3s COPY (449K/s) | 1.8× |
| 10M accounts (per-row commit) | 12.3s (815K/s) | 12m46s INSERT (13K/s) | 62× |
| Transfers throughput | ~48K sustained / 63K burst | 3,356 RPS | ~14× |
| Storage amplification | 8.2× | 1.2× | PG is lower |
fsync() syscalls per row |
0 (O_DSYNC makes each write() durable) |
0.42 | — |
| WAL flushes per 8,190 rows | 1 prepare (2 writes: prepare + header) | ~3,420 | ~3,420× |
| io_uring_enter per 100K rows | 4,225 | n/a | — |
| Concurrency model | single-threaded (by design) | scales with workers | different tradeoffs |
The ~14× ratio compares TigerBeetle’s sustained 48K to PostgreSQL’s 3.4K transfers. Against PostgreSQL’s INSERT-only run (per-row commit, 10M rows), TigerBeetle’s transfer rate is still ~4× higher (48K vs 13K). Each PostgreSQL transfer also updates two account rows, checks two foreign keys, and waits on row locks for hot accounts, which the INSERT-only test skips.
Checking the results with napkin math #
Two numbers from sirupsen’s napkin-math8 test both results:
SSD write + fsync (8 KiB): 300 µs Sequential SSD write, no fsync (8 KiB): 2 µs, 3 GiB/s
Hypothesis: PG is fsync-bound. PG commits one row = one fsync. A disk can do \(1\text{ s} / 300\text{ µs} \approx 3{,}300\) fsyncs per second, so one worker tops out at 3,300 RPS. Eight workers with group commit might add 3–4×, so expect ~10K RPS. Measured: 13K RPS, the same order of magnitude. The hypothesis holds.
Hypothesis: TB is write-bandwidth-bound. With O_DSYNC and 8,190-transfer batches, the cost per transfer should fall to raw write bandwidth. Raw data per transfer is 128 B, but each transfer writes up to 824 B of values into 11 LSM trees (Figure 3, step 4), and compaction writes them again at each level. The disk sees ~1 KB per transfer (8.2× total amp). With sirupsen’s 3 GiB/s reference:
Measured: 47K TPS, ~65× below that ceiling. Write bandwidth is not the limit. My M4 Mac Mini’s measured write bandwidth (dd bs=1M oflag=direct) is 1.3 GB/s, which still leaves a 27× margin.
/proc/pid/io during a 10M-transfer run shows that the bottleneck is disk reads.
| Metric | Value |
|---|---|
| Disk writes | 142 MB/s (30 GB total) |
| Disk reads | 9 GB/s (1.95 TB total!) |
| Read per transfer | ~195 KB |
| CPU (single thread) | 85% |
Each transfer looks up account balances through the LSM tree. With 10M accounts across several LSM levels, each lookup reads index blocks and data pages from several sorted runs: about 195 KB read per transfer. The VM’s disk is a file on the Mac, so the macOS page cache probably served many of these reads; 9 GB/s is more than this SSD reads. In a degradation test (1M-transfer chunks, sequential IDs, same DB), throughput held at ~41–46K RPS from 3M to 10M cumulative transfers (10 GB → 27 GB file). LSM compaction keeps up at this scale. Throughput will probably drop sharply when the working set exceeds the grid cache (1 GB in our test configuration).
sirupsen’s write numbers correctly showed that writes are not the bottleneck. To predict the throughput, you need the LSM read amplification, which depends on data size, tree depth, and bloom filter effectiveness. A napkin estimate does not include those details. Here the napkin math ruled out write bandwidth as the limit, but it did not predict the throughput.
What 1B/day costs #
The targets: average 12,000 TPS, daily peak 30,000 TPS, seasonal peak ~60,000 TPS.
TigerBeetle on a Mac Mini: one node measured ~48K transfers/sec sustained, ~63K burst. That is 4 billion transfers/day from a single $600 box.
One node handles the 1B target, but you don’t run payments on one node. TigerBeetle’s 6-replica cluster (the recommended production topology) still processes through a single primary, so it gives the same ~47K TPS with 6× the reliability.
For daily 30K peaks, one cluster is enough. For the 60K seasonal peak, use two clusters (12 nodes total) sharded by account range: half the account space per cluster, each primary handling ~30K TPS.
PostgreSQL on a Mac Mini: ~3,400 transfers/sec. To hit the 60K seasonal peak, you need ~18 sharded primary instances, each with a read replica, connection pooling, and its own VACUUM schedule. That is roughly an order of magnitude more to operate than the TigerBeetle footprint.
Storage for 90-day hot retention (with measured amplification):
$$ \underbrace{10^9 \times 128 \text{ B}}_{128 \text{ GB/day raw}} \times \underbrace{8.2}_{\text{TB amp}} \times 90 \text{ days} \times 6 \text{ replicas} \approx 567 \text{ TB} $$Across 12 nodes (two 6-replica clusters, sharded by account range), that is 47 TB per node = 3 × 20 TB NVMe each, 36 drives total, a single rack. With TigerBeetle’s 8× amplification or PostgreSQL’s 1.2× plus separate WAL and index maintenance, the order of magnitude is the same (~100 TB hot tier per data center).
Neither storage nor throughput is the hard constraint. The harder constraint is the operational blast radius of each design: how much of the system one failure takes down.
Hot, warm, and cold tiers #
Indian banking regulations require 10 years of transaction retention. At 128 GB/day raw, that is 467 TB before compression, too much for TigerBeetle’s hot tier. Throughput held at ~41–46K RPS up to a 27 GB file, but at 1B/day the data file grows by ~1 TB/day (after 8.2× amplification). At some point the working set exceeds the grid cache and throughput will drop. So tiering is part of the design from the start.
The plan is to checkpoint and archive. A TigerBeetle account holds a running balance, the cumulative effect of every transfer ever processed. Snapshot the balances at a cutoff date, and every transfer before that date becomes archival. The old transfers are needed only to audit history, because the balances give the current state.
| Age | Tier | Storage | Query Latency |
|---|---|---|---|
| 0–90 days | Hot — TigerBeetle cluster | ~100 TB × 6 replicas = ~600 TB | single-digit ms |
| 90 days–1 year | Warm — ClickHouse / Parquet on NVMe | ~15 TB (35 TB raw, compressed 2–3×) | seconds |
| 1–10 years | Cold — S3 / GCS Parquet, partitioned by day | ~90 TB (420 TB raw, compressed ~4.7×) | minutes |
For the cold tier, I tested every Parquet codec on TigerBeetle’s 128-byte Transfer schema. The best was zstd(3) with dictionary encoding: 27.3 B/row, 4.7× compression, 0.16 s to write 100 MB.
- zstd(3) does ~97% of the work. Levels 9 and 22 give <1% more compression for 10–50× the CPU.
- Dictionary adds ~2% on the 12 low-cardinality columns (
ledger,flags,code, zero-fields). - Delta on
id_hiandtimestampadds <1% once zstd has run.BYTE_STREAM_SPLITon random u64s gets to 25.7 B/row (4.98×) at no extra cost. - 80 of 128 bytes are random (amount + account IDs), so they do not compress.
- The ratio stops improving at 81K rows (10× a TB batch), so millions of rows are not needed to measure it.
At 25.7 B/row, a 10-year cold tier is ~94 TB on S3, ~$2,150/month. The full benchmark is 200 lines of Python and runs in 15 seconds.
The archival pipeline #
- Scheduled rollover job (nightly): query TigerBeetle for transfers with
timestamp < NOW() - 90dand stream them to Parquet files partitioned by day. Save the account balances at the cutoff date, the checkpoint, alongside the archived transfers. - Columnar compression when the files are written: zstd with dictionary encoding, ~4.7× on this schema.
- Compact the hot tier. TigerBeetle has no DELETE; it is an append-only ledger by design. The current way to compact is a rolling data-file migration: format a new file, replay accounts + recent transfers, swap.
- Rehydration: for a legal-hold query or dispute, load the relevant Parquet partition into a warm ClickHouse instance. The checkpoint balances let you validate the rehydrated transactions against the known-good state at that date. Don’t import them back into the hot ledger; that breaks the immutability guarantee.
When to use what #
TigerBeetle is a ledger accelerator. If the operation is debit A, credit B, enforce invariants, commit, and it happens millions of times per day, it belongs in TigerBeetle. Everything else stays in Postgres: KYC, disputes, merchant metadata, reporting, and anything that needs a JOIN or a WHERE clause you haven’t thought of yet. Most production deployments will run both.
Why the numbers differ #
Both systems run on the same SSD. They differ in what they ask the disk to do per transfer:
TigerBeetle:  O_DSYNC + O_DIRECT + io_uring, 8,190-tx batches    →  47K RPS   (not disk-bound)
PostgreSQL:   one WAL flush per ~2.4 commits (group commit)       →  13K RPS   (fsync-bound)

                        ↓
                  ~4× throughput gap on the per-row-commit workload
                  same durability guarantees; the batching model differs, and no config setting changes it
Both systems give strong per-commit durability when configured correctly: PostgreSQL with synchronous_commit = on, TigerBeetle with O_DSYNC writes. Turning synchronous_commit off makes COMMIT faster, but a crash can lose the last few hundred ms of committed data.
If every payment must be durable the instant it’s written and your clients can’t batch, the per-commit fsync cost sets your throughput limit. If they can batch, the cost is shared across the batch.
What we showed #
- Postgres already batches, but only across commits that are waiting. Group commit shares each WAL flush among about 2.4 commits with 8 backends. A TigerBeetle client puts up to 8,190 transfers in one request, and one prepare makes them durable.
- One core is enough for ~48K RPS. TigerBeetle sustains that over 10M transfers and bursts to ~63K, and more client goroutines do not change it.
- TigerBeetle makes zero
fsync()syscalls and keeps full durability. 100,000 transfers took 4,241 syscalls, oneio_uring_enterper ~11 I/Os (~24 transfers).O_DSYNCputs durability into the write itself. - fsync limits PostgreSQL. Each call takes only 163 µs, but 4.17 million of them fill ~89% of wall-clock time for 10M INSERTs. With
COPY, the same PostgreSQL loads accounts 34× faster. - TigerBeetle’s 8.2× storage amplification comes from indexes and compaction. Each transfer writes up to 824 B into 11 of the 33 LSM trees, and compaction rewrites them at each level. Plan for ~1 TB/day on disk per 128 GB of raw transfers. This post compares the two at the use-case level (transactions + ledger); it does not match their indexes.
- TigerBeetle is limited by reads. It reads ~195 KB per transfer, mostly account lookups through the LSM tree, and writes 142 MB/s. I have not yet measured where throughput drops once the working set exceeds the 1 GB grid cache.
Reproduce this yourself #
Every number above was measured on one Mac Mini, in one afternoon, on a Podman VM you can create in three commands.
podman machine init --cpus 4 --memory 8192 --disk-size 40
podman machine start
podman machine ssh "sudo rpm-ostree install bpftrace --idempotent" && \
  podman machine stop && podman machine start
Full setup, teardown, and bpftrace scripts are in the benchmark repo. Cleanup is one line: podman machine rm -f.
TigerBeetle® is a trademark of TigerBeetle, Inc. PostgreSQL® is a trademark of The PostgreSQL Global Development Group. This post is an independent benchmark and analysis — it is not affiliated with, endorsed by, or sponsored by either project. All trademarks belong to their respective owners.
Corrections #
2026-05-06 — Two corrections from Chaitanya Bhandari (@chaitybhandari) of the TigerBeetle team:
- TigerBeetle is fully ACID. Original framing (“sidesteps the ACID tax”) was wrong. The data file is opened with
O_DSYNC(linux.zig), so everywrite()includes the durability barrier (the syscall returns only once data is on stable storage). The throughput gain comes from batching: one durable WAL prepare per 8,190 transfers. TigerBeetle does not skip fsync semantics. - 27 secondary indexes, not 3. Per
state_machine.zig: Account (7) + Transfer (12) + TransferPending (1) + AccountEvents (7). The Transfer groove has 14 LSM trees in total (id+timestamp+ 12 secondary), and an insert writes to all of them, which explains the 8.2× on-disk amplification.
Deeply grateful to Chaitanya for the close read and source-level pointers.
2026-09-28 — Replaced the hero image and the data-file diagram with interactive figures, added a group-commit figure, and fixed these while checking them against the TigerBeetle 0.16.78 source and the benchmark code:
- A benchmark transfer writes to 7 of the Transfer groove’s 14 trees, not all 14. Zero fields in optional indexes (
pending_id,user_data_*) are not indexed. Per transfer, TigerBeetle also writes two account versions and a 256 BAccountEvent: up to 824 B of values in 11 trees. - The superblock zone is 96 KiB (4 × 24 KiB), not ~64 MiB. The 64 MiB is the client-replies zone, which the old diagram left out.
- The commit quorum for 6 replicas is 3, not 4. 4 is the view-change quorum. The old text also called the replica count Byzantine-safe; VSR tolerates crashes and storage faults, not Byzantine replicas.
- Postgres does batch commits. 0.42 fsyncs per row means about 2.4 commits share each WAL flush (group commit), not one flush per commit as the old hero image and summary box said. A TigerBeetle prepare is also two writes (the prepare and its header sector), not one.
- The Postgres transfer benchmark runs two
UPDATEs and oneINSERTper transaction, not anINSERTwith FK checks alone. - TigerBeetle clients do not wait to fill a batch, so the 273 ms fill time is not the latency at 30K TPS.
- 4,241 syscalls per 100,000 transfers (one
io_uring_enterper ~24), not ~4,600 (one per ~22).
2026-10-17 — More fixes from a second read:
- The
io_uringtrace shows about 46,000 I/Os for about 4,200io_uring_entercalls, not “tens of syscalls”, so one call per ~11 I/Os. - The
io_uringtail runs from 128 ms to 1 s, not 128–512 ms, and the trace does not show its cause. - PostgreSQL makes 0.76 flushes per transfer; 0.42 is per row in the INSERT-only run. Against that run TigerBeetle is ~4× faster, not ~5×.
- The 195 KB read per transfer is a byte count, not 24 measured 8 KB page reads, and much of the 9 GB/s probably came from the host’s page cache.
- The warm and cold tiers hold ~15 TB and ~90 TB after compression, not ~45 TB and ~150 TB.
Colophon #
This post stayed in draft: true for 13 months before an LLM with infinite patience for re-running benchmarks showed up. Sonnet 4.6 drafted and ran the first traces; Opus 4.6 came later for the skepticism sweep — caught a 4.5M→4.17M fsync discrepancy, a 567-vs-564 TB Parquet math bug, two dead TB-docs links, and a concurrency-degradation claim that turned out to be an artifact of dirty test state. 1,279 tool turns, $266, 95% cache hit. Writing a blog post about a $600 box that can do 4 billion payments/day cost half a $600 box.
As a wise man once said: take microbenchmarks with a pinch of salt. These numbers are from one Mac Mini, one afternoon, one workload. Your mileage will vary with hardware, kernel version, data distribution, and whether Mercury is in retrograde. The ratios and the bottleneck analysis transfer across environments better than the exact RPS.
-
pratikgajjar/1b-payments— benchmark code, eBPF scripts, and setup guide for reproducing every number in this post. ↩︎ -
Simon Eskildsen, Advanced Napkin Math: Estimating System Performance from First Principles (YouTube talk). ↩︎
-
Benchmarks were performed on an Apple M4 Mac Mini (10-core, 24 GB RAM) inside a Podman Linux VM (Fedora CoreOS 41, 4 CPU / 8 GB). Real-world performance will vary with storage, kernel, and workload. ↩︎
-
XLogFlushinsrc/backend/access/transam/xlog.c↩︎ -
VR = Viewstamped Replication — a leader-based consensus protocol by Oki & Liskov (1988), in the same family as Paxos and Raft. TigerBeetle’s implementation is documented in their VSR protocol docs. ↩︎
-
TigerBeetle: cluster fault tolerance and
quorums()insrc/vsr.zig. ↩︎ -
Simon Eskildsen,
sirupsen/napkin-math— the reference numbers for back-of-the-envelope system sizing. ↩︎ ↩︎