Most slow Postgres queries read more pages than they need. Postgres
reads and caches data in 8 KB pages, so the page count is the
number to measure. This post explains why one lookup reads
33,333 pages without an index and 4 with one, when the planner correctly
chooses not to use your index, how to read EXPLAIN, and what SELECT * and LIMIT
save and do not save.
The sample table #
users has one million rows: an id, an email, a random score, a
seq column whose values follow the order of rows on disk, a name, a
created_at, and a short bio. Each of email, score, seq, and
created_at has a B-tree index; Figure 1 also shows one lookup measured
before the email index existed. About 30 rows fit on an 8 KB page, so the
table is 33,333 pages. Every number in this post comes from this table on
PostgreSQL 18.4 on an Apple M3 Max with default settings, except that
parallel workers and JIT are off to keep the plans simple. The SQL to build it is at the
end of the post.
Why one row can cost 33,333 pages #
Find one user by email. Without an index on email, Postgres cannot know
where that row is, so it reads every page of the table and tests every row. That is a sequential scan. It is
fast when a query needs most of the table, and slow when a query needs
one row.
An index is a sorted copy of one or more columns, and each entry points to
a row in the table. In Figure 1, guess how many pages the same lookup reads
with an index on email, then check.
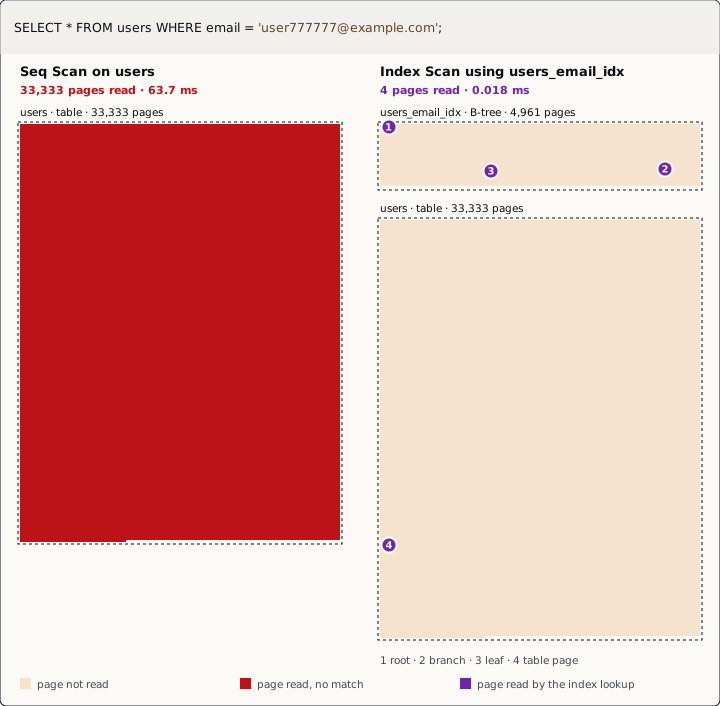
users and its email index are drawn to scale, one square per 8 KB page, each at its real block number.How the index finds the row #
A B-tree index is itself made of 8 KB pages, arranged in levels. The root page splits the key range between its children, each child splits it again, and the leaf pages at the bottom hold every key with the address of its row. Postgres reads one page per level, then the table page: in Figure 1 that is root block 164, branch block 3662, leaf block 3735, and table block 25924.
The tree is short because each page holds hundreds of keys. Here the root points to 32 branch pages, each branch page points to about 150 leaf pages, and each leaf holds about 200 keys. A table 100 times larger needs one more level, so one more page per lookup.
An index costs disk space and write time. users_email_idx takes 4,961
pages (about 40 MB), and every INSERT and most UPDATEs also write to
it. Index only the columns that your frequent WHERE clauses filter on.
When Postgres does not use the index #
An index does not guarantee an index scan. The planner chooses a plan from
statistics that ANALYZE collects from a sample of rows, 30,000 by default: the row count, the most common values, a
histogram of each column, and the column’s correlation, which says how
closely the column’s order follows the order of rows on disk. Autovacuum
runs ANALYZE in the background. Run it yourself after a large load or
delete.
From these statistics the planner estimates how many rows a filter matches
and what each plan costs, and it runs the cheapest one. Costs are in
abstract units: reading one page in sequence costs 1 (seq_page_cost), and
reading one page at random costs 4 (random_page_cost).
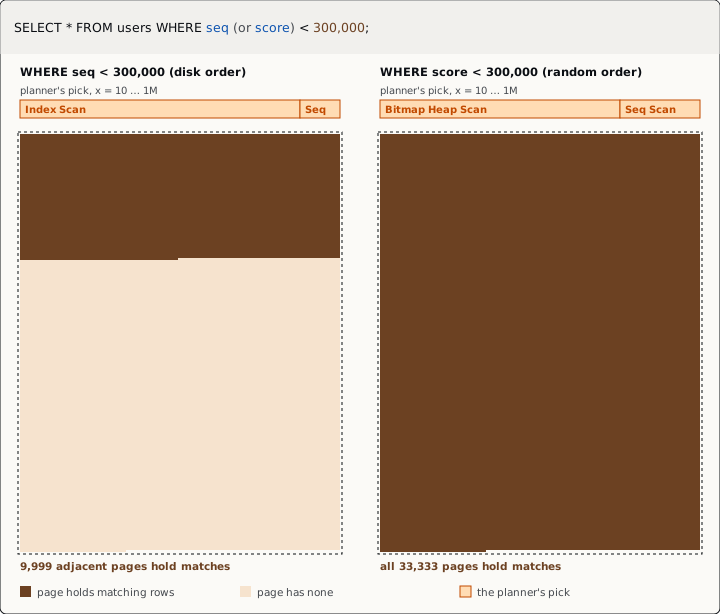
x to change how many rows match. Each scan type was forced with enable_* settings to get its cost and time. Times are medians of five EXPLAIN ANALYZE runs with the table in memory.score and seq have the same kind of index and the same filter. Their
plans differ because their correlation differs. Rows with a small seq are
stored together at the start of the table, so an index scan reads each table page once, and it
stays the cheapest plan up to 70% of the rows. Rows with a small score are
spread across all 33,333 pages. For those the planner uses a bitmap scan,
and between 30% and 50% of the rows it switches to reading the whole table.
A lower random_page_cost, which is common on SSDs, moves that switch to
a larger fraction of rows. When EXPLAIN shows a sequential scan on an
indexed column, the filter can match too many rows for the index to be
faster.
Reading EXPLAIN #
EXPLAIN shows the plan the planner picked, with its estimates.
EXPLAIN ANALYZE also runs the query and adds the actual row counts and
times. Because it runs the query, wrap an UPDATE or DELETE in BEGIN
and ROLLBACK. BUFFERS adds the number of pages the query accessed; since
PostgreSQL 18, ANALYZE includes it by default.
EXPLAIN (ANALYZE, BUFFERS)
SELECT * FROM users WHERE email = 'user777777@example.com';

 Index Scan using users_email_idx on users  (cost=0.42..8.44 rows=1 width=227) (actual time=0.007..0.008 rows=1.00 loops=1)
   Index Cond: (email = 'user777777@example.com'::text)
   Index Searches: 1
   Buffers: shared hit=4
 Planning Time: 0.091 ms
 Execution Time: 0.018 ms
Read these fields first:
rows=1in the first bracket is the estimate;rows=1.00in the second is the actual count. A large gap means the statistics are wrong or out of date, and the plan may be wrong too.Buffers: shared hit=4is the four pages from Figure 1.hitpages were already in Postgres’s shared buffers;readpages came from the operating system or the disk.cost=0.42..8.44is the cost to return the first row and all rows, in the units from Figure 2.
What SELECT * and LIMIT save #
“Avoid SELECT *” and “use LIMIT” both help, but not always by reading
fewer pages.
Postgres stores each row as one piece on a table page, so naming two
columns instead of * does not reduce the pages a sequential scan reads.
It reduces the work after the read: fewer bytes to sort and to send, and
large values stored outside the row (TOAST) are fetched only when the query
asks for them. When every column a query needs is in one index, Postgres can
answer from the index alone and skip the table.
LIMIT stops a query after N rows, but it saves reads only if the plan
produces rows in the requested order as it goes. OFFSET works the same
way: OFFSET 100000 reads 100,000 rows and discards them. Try both
tips on the goals in the figure.
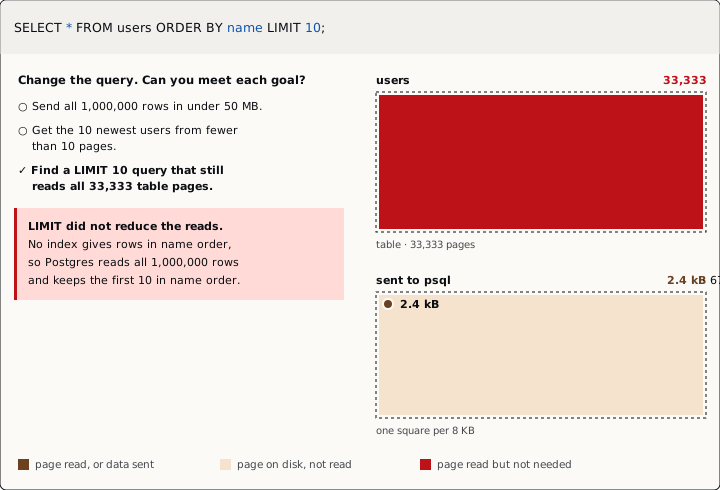
EXPLAIN (ANALYZE, BUFFERS) output from one run. Client time is psql fetching every row over a Unix socket, median of five runs. work_mem is the default 4 MB.On this table SELECT * sends 245 MB to the client and SELECT id, name
sends 40 MB, from the same 33,333 pages. ORDER BY created_at DESC LIMIT 10
reads 5 pages, and ORDER BY name LIMIT 10 reads all 33,333, because no
index gives rows in name order. An index that matches the ORDER BY
fixes that.
JOINs #
Index the columns you join on. Postgres indexes a primary key
automatically, but not a foreign key column that points to it, so a column
such as orders.user_id needs its own index. The planner chooses the join
order itself, for up to eight tables by default (join_collapse_limit), so
the order of tables in your query does not matter.
Caching #
Postgres caches pages. It does not cache query results. Recently used pages stay in
shared buffers (shared_buffers, 128 MB by default) and in the operating
system’s file cache; that is the difference between hit and read in
Buffers. To reuse a result you compute often, cache it in the
application, in a cache such as Redis, or in a materialized view that you
refresh on a schedule.
Takeaways #
- Measure the pages a query reads. Check every change with
EXPLAIN (ANALYZE, BUFFERS)on real data. - For one row, an index reduces 33,333 page reads to 4. The index costs disk space and write time.
- When a filter matches a large part of the table, a sequential scan is often the fastest plan.
- A narrow select reads the same table pages as
SELECT *. It reduces sort size and bytes sent, and it can allow an index-only scan. LIMITsaves reads only when an index gives rows in the requested order.
Reproduce these numbers #
This builds the sample table on PostgreSQL 18. setseed makes the random
columns the same on every run, so block numbers and keys match the figures.
SELECT setseed(0.42);
CREATE TABLE users (
  id         bigint PRIMARY KEY,
  email      text        NOT NULL,
  score      int         NOT NULL,  -- random, 0 to 999,999
  seq        int         NOT NULL,  -- follows the order on disk
  name       text        NOT NULL,
  created_at timestamptz NOT NULL,
  bio        text        NOT NULL
);
INSERT INTO users
SELECT g, 'user' || g || '@example.com', floor(random() * 1000000)::int, g - 1,
       md5(random()::text),
       '2024-01-01 00:00:00+00'::timestamptz + g * interval '30 seconds',
       repeat('lorem ipsum ', 12)
FROM generate_series(1, 1000000) AS g;
CREATE INDEX users_email_idx ON users (email);
CREATE INDEX users_score_idx ON users (score);
CREATE INDEX users_seq_idx ON users (seq);
CREATE INDEX users_created_at_idx ON users (created_at);
VACUUM ANALYZE users;
SET max_parallel_workers_per_gather = 0;
SET jit = off;