Before I started training, a 4K took me about 38 minutes. In December 2024 I ran a 5K in 24:45. This post explains how I did it. I set one clear goal at a time, worked on one running metric at a time, and measured each run on a Garmin watch. The post also shows which form numbers matter, how yours compare with other runners, and which one to work on first.
tldr;
- Set a clear goal.
- Track your performance, focus on one metric at a time.
- Vary your runs, but maintain consistency.
- Hold a steady pace through your target run.
- Focus on nutrition and strength training.
Why running #
I am a 27-year-old software engineer, writing in 2024. I sit for most of my workday. Since grade 12 I have wanted a six-pack, because it is seen as ‘cool.’ As a football fan, I know players peak in their late twenties to early thirties. An analysis by The Athletic1 puts the peak age for different positions at 27 to 31. So I set a goal to reach peak physical fitness by my late twenties.
I prefer outdoor sports to the gym. I would rather play outside for hours than work out indoors. So my goal became a body fat percentage of about 8%. Everyone has abdominal muscles; fat hides them.
“The most successful people I know believe in themselves almost to the point of delusion.” – Sam Altman (@sama)
Of the outdoor options, I chose running because it is easy to start and needs little setup.
Measure first #
I work in tech, where we measure systems to keep them efficient and to spot anomalies. I wanted the same for my running, so I bought a Garmin watch that records many running metrics. “If you can measure it, you can improve it.”
The rest of the kit is simple: Skechers running shoes for every run, comfortable well-fitting clothes, and quiet roads and public parks in the city.
Start slow #
I started slow to lower the risk of injury. New runners make mistakes, and intense workouts too early can cause strains. I had run a 4K in about 38 minutes with no preparation, so I set a more achievable first goal.
Garmin’s AI coach built me a plan for a 5K in about 35 minutes. The plan was hard, but manageable. The plan mixed steady, interval, and hill runs, with rest days for recovery. It set when and how far to run each day, based on data from my first few sessions. That structure kept me consistent and helped me avoid injury.
“No man has the right to be an amateur in the matter of physical training. It is a shame for a man to grow old without seeing the beauty and strength of which his body is capable.” – Socrates
Form: the input metrics #
The watch reports many numbers. I split them in two. Input metrics2 describe your form: cadence, vertical ratio, vertical oscillation, and ground contact time. You improve them through steady training.
Output metrics are the effect: pace, heart-rate zones, power zones, and stride length. They come later in this post.
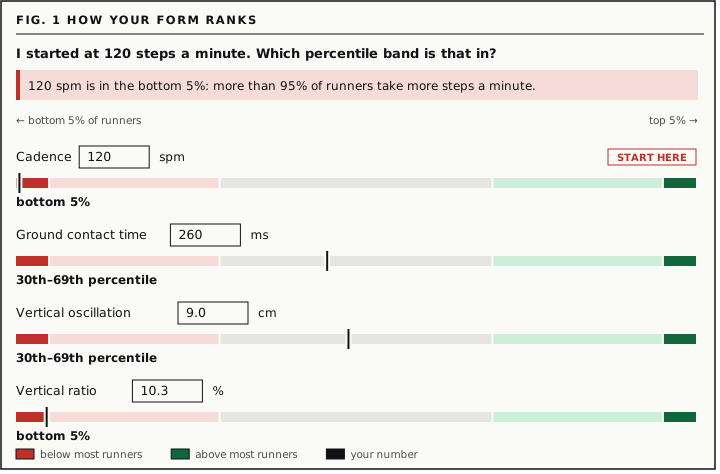
Garmin compares each input metric with other runners and puts it in a percentile band. Start with my own first number, then type yours to see which band each one is in and which one to work on first.
Cadence #
Cadence is the number of steps per minute (spm), both feet counted. Garmin’s data from runners of all levels shows that more experienced runners tend to have a higher cadence. An often-cited target is 180 spm. Higher cadence goes with lower vertical oscillation and shorter ground contact time. Taller runners tend to have a somewhat lower cadence.
Each table in this section gives Garmin’s five percentile bands and the range of the metric in each band.
| Percentile in Zone | Cadence Range |
|---|---|
| > 95% | >185 spm |
| 70-95% | 174-185 spm |
| 30-69% | 163-173 spm |
| 5-29% | 151-162 spm |
| < 5% | < 151 spm |
Vertical Ratio #
Vertical ratio measures running efficiency. It is vertical oscillation divided by stride length, shown as a percentage. Stride length is the benefit (forward movement). Vertical oscillation is an energy cost (up-and-down movement). A lower ratio means a smaller cost for the same benefit.
| Percentile in Zone | VR Range |
|---|---|
| > 95% | < 6.1% |
| 70 - 95% | 6.1% - 7.4% |
| 30 - 69% | 7.5% - 8.6% |
| 5 - 29% | 8.7% - 10.1% |
| < 5% | > 10.1% |
Vertical Oscillation #
Vertical oscillation is how far your torso moves up and down on each step, in centimetres (cm).
Many coaches believe lower oscillation is more economical, because less energy goes into moving up and down. It also usually means less stress on the lower body at impact. More experienced runners tend to have lower oscillation, but faster paces often raise it a little. Vertical ratio takes this into account.
| Percentile in Zone | VO Range |
|---|---|
| > 95% | < 6.4 cm |
| 70 - 95% | 6.4 - 8.1 cm |
| 30 - 69% | 8.2 - 9.7 cm |
| 5 - 29% | 9.8 - 11.5 cm |
| < 5% | > 11.5 cm |
Ground Contact Time (GCT) #
Ground contact time is how long your foot stays on the ground on each step, in milliseconds (ms). It is especially short for elite runners. Almost all experienced runners stay under 300 ms, likely because they have learned to pick up their feet quickly and not to over-stride at landing. A forefoot strike can help reduce GCT.
| Percentile in Zone | GCT Range |
|---|---|
| > 95% | < 208 ms |
| 70 - 95% | 208 - 240 ms |
| 30 - 69% | 241 - 272 ms |
| 5 - 29% | 273 - 305 ms |
| < 5% | > 305 ms |
Two videos helped my form. The first covers foot placement training for more efficient running.
Cadence first: running to music #
When I began, my average cadence was about 120 spm, in the bottom 5% of runners (below 151 spm). So cadence was the first metric I worked on. Music helps me hold a steady pace and cadence. Playlists with a fixed beat act as a metronome:
- Spotify: https://open.spotify.com/artist/2pvCOW7OAq8uJSnQlL8Yhq has playlists at 140, 150, 160, 170, and 180 spm.
- YouTube Music: https://music.youtube.com/channel/UCM2RlbR4aNXSKVZfVajvCGQ has similar playlists at a range of tempos.
With these playlists, time passes faster, a steady pace and cadence is easier to hold, and I stay motivated.
Output metrics #
Pace = cadence × stride length #
Pace is the time to run one kilometre (min/km) or one mile (min/mile). Stride length is the distance covered on each step, in metres.
speed (m/min) = cadence (steps/min) × stride length (m)
pace (min/km) = 1000 / (cadence × stride length)
Pace depends on only two numbers: cadence (how often your feet land) and stride length (how far you travel on each step). Ground contact time and vertical ratio are not in the formula. They change how much energy each step takes.
My next goal is a 5K in 20:00, which is 250 m every minute. At 180 spm that still needs 1.39 m per step, so cadence alone does not get there. Longer steps add speed without much more effort. Balance them with cadence, or you over-stride, which can cause injury. Train one metric at a time: raise cadence, or lower ground contact time or vertical ratio. Calisthenics builds the strength that shortens ground contact.
Heart rate zones #
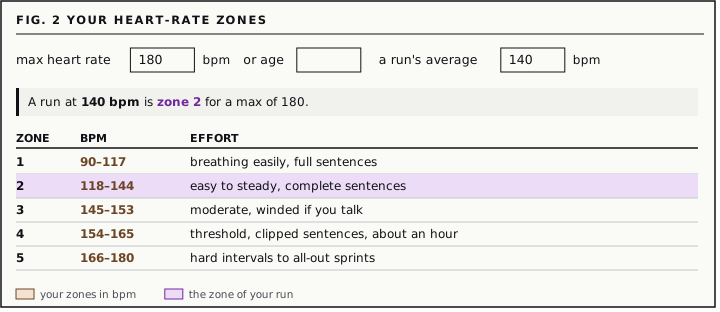
Heart rate zones are ranges of heart rate that match levels of effort. There are usually five, from easy (zone 1) to maximum effort (zone 5). Each type of run, such as fat burning, endurance, or speed, has a target zone. Training in the target zone helps prevent overtraining.
| Zone | % of max | Effort |
|---|---|---|
| 1 | 50-65% | 2-3 out of 10. Breathing easily. Speaking full sentences. Feels like you could go all day! |
| 2 | 65-80% | 3-4 out of 10. Easy to steady endurance. Can still speak in complete sentences. |
| 3 | 80-85% | 4-6 out of 10. Moderate but moving. At the upper end, you get winded quickly if you try to talk and might taste metal. |
| 4 | 85-92% | 6-7 out of 10. Lactate threshold. This is a workout: sentences are clipped. But it’s still mostly aerobic. You can hold it for about one hour. |
| 5 | 92-100% | 8-10 out of 10. High-intensity. Everything from very hard VO2 intervals to all-out sprints. |
Type your max heart rate to get your zones in bpm. If you do not know your max, the age field uses 220 − age, the default Strava uses.3 A measured max is better.
More on zones: https://stories.strava.com/articles/understanding-heart-rate-zones-and-how-they-impact-your-training
Power #
Power, in watts, is your energy output while running, independent of pace and terrain. Training by power lets you hold a constant output when terrain or conditions change, which helps efficiency.
Time in power zone #
Power zones work like heart rate zones, but use watts. Time in power zone is how long you spend in each zone. Time spread across several zones helps endurance, speed, and efficient energy use.
Recovery and fuel #
Stretching #
Stretching before and after runs keeps you flexible, helps prevent injuries, and aids recovery. These are the routines I use.
Pre-run #
Post-run #
Nutrition #
Carbohydrates #
Carbs are the main fuel for intense exercise like running. Muscles store them as glycogen. To keep glycogen up:
Time your carbs: eat a carb-rich meal 3-4 hours before your run, so it is digested in time.
Top up during runs: on long runs or races, take easily digested carbs, such as gels or chews, every 45 minutes to hold blood sugar.
Protein #
After a run, muscles need protein to repair micro-tears and build new tissue. Aim for 20-30 g within the first hour.
Protein sources: Tofu and paneer are complete proteins. Beans, lentils, and almonds are not complete on their own, so pair them with grains, like dal with rice.
Healthy Fats #
Fats are another energy source. They also help the body absorb fat-soluble vitamins.
Hydration #
Water is about 60% of body weight and matters for every body function, including running. Drink water through the whole day, as well as around runs. Base your plan on your sweat rate: weigh yourself before and after runs to estimate it.
Micronutrients #
Eat a variety of colourful fruits and vegetables to get enough vitamins and minerals.
What changed #
- Completed a 100km challenge in 30 days (Oct 14, 2024).
- Reduced BMI from 24.1 to 22.3.
- Resting heart rate (RHR) improved to less than 50 beats per minute.
One goal at a time #
- 5K in about 35 minutes (7:00 min/km). Done at medium effort, October 2024.
- 5K under 30 minutes (6:00 min/km). Done, Nov 15, 2024.
- 5K under 25 minutes (5:00 min/km). Done, Dec 4, 2024.
- 10K under 60 minutes (6:00 min/km). Done, Feb 6, 2025.
- 5K under 20 minutes (4:00 min/km). In progress, by 2026.

Thank you, Kush, Dhruv, and Sandeep, for your direct and indirect support throughout this training.
“Delulu is the solulu” - Gen Z
It’s not a coincidence that most successful people, when looking back at their younger selves, cite the delusional hope they had back then as the fuel that propelled them through the toughest parts of their lives and careers. – Mark Travers, Forbes
-
https://www.nytimes.com/athletic/2935360/2021/11/15/what-age-do-players-in-different-positions-peak/ ↩︎
-
The Garmin Connect app was used for definitions and estimated metrics about runners. The percentile bands are also in Garmin’s watch manuals: https://www8.garmin.com/manuals/webhelp/forerunner920/EN-US/GUID-2C73735B-C792-412D-AA92-706A8647DD77.html (cadence, ground contact time) and https://www8.garmin.com/manuals-apac/webhelp/forerunner965/EN-SG/GUID-70D4A5A7-9C6A-4C0D-8AA9-5B34BDF5A128-1030.html (vertical oscillation and vertical ratio at the chest). Newer manuals shift the cadence and contact-time bands slightly, for example > 183 spm and < 218 ms for the top 5%. ↩︎
-
https://support.strava.com/en-us/articles/15401923-heart-rate-zones ↩︎